Radiologist Salary in Minnesota: $510,446 (2026)
Quick Answer:Across Minnesota's 44 metropolitan areas, the average median radiologist pay sits at $510,446/year heading into 2026 — a figure projected from 2025 BLS OEWS wage data for SOC 29-1224. Because Minnesota sits at BEA RPP 98.5 (1% below the U.S. baseline), that statewide median translates to roughly $518,219 in nationally-comparable purchasing power. Highest-paying metros: Minneapolis ($745,230), St. Paul ($737,748), Bloomington ($732,025).
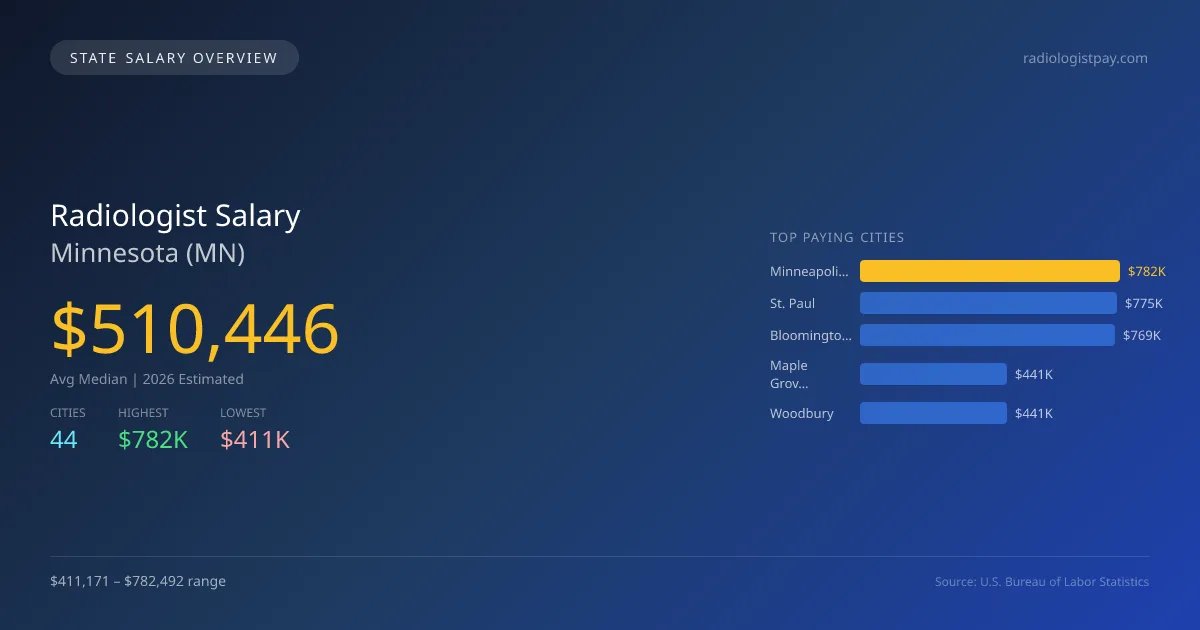
In Minnesota, radiologists are projected to earn an average median salary of $510,446 in 2026, significantly surpassing the national median of $441,903 by 15.5%. This strong financial outlook reflects the state’s high demand for radiological services. The salary varies notably across cities, with Minneapolis offering the highest at $782,492, while Faribault presents the lowest at $411,171, resulting in a substantial salary gap of $371,321. Factors influencing these disparities include the cost of living, the availability of advanced medical facilities, and local competition for skilled professionals. Minnesota has specific factors affecting radiologists, including state licensing requirements and scope of practice laws, which may differ from other states. The demand for radiologists is also driven by an aging population and advancements in imaging technology. Currently, 536 radiologists are employed statewide, with a projected annual growth rate of 5.00%, indicating a healthy job market. Other top-earning cities include St. Paul at $774,635 and Bloomington at $768,626. Understanding these figures and market dynamics is crucial for anyone considering a career in radiology within Minnesota.
Minnesota Radiologist Salary Range
Overall salary range in Minnesota: $206,829 (lowest entry-level) to $1,183,848 (highest top earner)
Minnesota vs National Average
Minnesota radiologists earn 15.51% more than the national median (+$68,543/year difference).
Minnesota Radiologist Salary Distribution (2026)
Radiologist salaries in Minnesota range from $282,233 (entry-level, 10th percentile) to $712,964 (top earners, 90th percentile), with a median of $510,446. The Minnesota median is $68,543 above the US national median of $441,903. The average hourly rate is $245.41/hr. Approximately 536 radiologists are employed across 44 cities.
2021 BLS Actual
$399,948
2025 BLS Actual
$486,139
2026 Current Est.
$510,446
2021–2027 Growth
+34.0%
Salary Trajectory for Radiologists in Minnesota (2021–2027)
2021–2025: actual BLS OEWS data for this metro area. 2026+: CAGR 5.00% projection.
| Year | Annual Salary | Status |
|---|---|---|
| 2021 | $399,948 | Actual |
| 2022 | $419,945 | Actual |
| 2023 | $440,942 | Actual |
| 2024 | $392,910 | Actual |
| 2025 | $486,139 | Actual |
| 2026(current) | $510,446 | Estimated |
| 2027 | $535,968 | Projected |
Based on 5 years of BLS OEWS data for the Minnesota metropolitan area, the median radiologist salary grew 21.6% from $399,948 (2021) to $486,139 (2025). At a 5.00% compound annual growth rate, salaries are projected to reach $535,968 by 2027 — a total increase of $136,020 (34.01%) from 2021.
Note: Historical values (2021–2025) are actual BLS OEWS figures for the Minnesota metropolitan area, sourced from annual Occupational Employment and Wage Statistics surveys. 2026–2026 figures are current estimates, and 2027 values are projections, calculated using a 5.00% CAGR derived from 5-year BLS historical data. Actual salaries may vary based on employer, experience, certifications, and local market conditions.
Top 5 Highest Paying Cities in Minnesota
Lowest Paying Cities in Minnesota
Best Value Cities for Radiologists in Minnesota
When adjusted for local cost of living, these Minnesota cities offer the most purchasing power for radiologists.
| City | Nominal Salary | CoL Index | Adjusted Salary |
|---|---|---|---|
| St. Paul | $774,635 | 98.5 | $786,431 |
| Bloomington | $768,626 | 98.5 | $780,331 |
| Minneapolis | $782,492 | 104.822 | $746,496 |
| Maple Grove | $441,177 | 98.5 | $447,895 |
| Woodbury | $441,005 | 98.5 | $447,721 |
Adjusted salary = nominal salary × (100 / CoL index). CoL index: 100 = national average. Lower index = lower cost of living.
Salary by Experience Level in Minnesota
| Experience Level | Estimated Annual |
|---|---|
| Entry Level (0-2 years) | $282,233 |
| Mid Career (3-7 years) | $510,446 |
| Experienced (7+ years) | $712,964 |
Estimates based on BLS percentile data averaged across Minnesota metro areas. Individual pay varies by employer, certifications, and specialization.
All 44 Cities in Minnesota
| # | City | Median Salary |
|---|---|---|
| 1 | Minneapolis | $782,492 |
| 2 | St. Paul | $774,635 |
| 3 | Bloomington | $768,626 |
| 4 | Maple Grove | $441,177 |
| 5 | Woodbury | $441,005 |
| 6 | Eden Prairie | $440,592 |
| 7 | Duluth | $438,971 |
| 8 | Rochester | $438,167 |
| 9 | Owatonna | $432,096 |
| 10 | St. Cloud | $432,076 |
| 11 | Brooklyn Park | $431,525 |
| 12 | Plymouth | $430,767 |
| 13 | Roseville | $430,508 |
| 14 | Chaska | $430,170 |
| 15 | Minnetonka | $430,077 |
| 16 | Cottage Grove | $429,596 |
| 17 | Burnsville | $429,249 |
| 18 | Lakeville | $427,664 |
| 19 | Chanhassen | $427,367 |
| 20 | Inver Grove Heights | $426,692 |
| 21 | Eagan | $426,630 |
| 22 | Brooklyn Center | $426,523 |
| 23 | Elk River | $426,455 |
| 24 | Prior Lake | $426,017 |
| 25 | Ramsey | $424,463 |
| 26 | Blaine | $422,665 |
| 27 | Apple Valley | $422,010 |
| 28 | Shakopee | $421,591 |
| 29 | Coon Rapids | $421,528 |
| 30 | Savage | $420,848 |
| 31 | Edina | $420,803 |
| 32 | Maplewood | $419,564 |
| 33 | Andover | $419,463 |
| 34 | Richfield | $419,261 |
| 35 | St. Louis Park | $419,227 |
| 36 | Moorhead | $418,619 |
| 37 | Mankato | $418,517 |
| 38 | Northfield | $415,590 |
| 39 | Hastings | $414,706 |
| 40 | Fridley | $412,843 |
| 41 | Winona | $412,505 |
| 42 | Shoreview | $412,336 |
| 43 | Austin | $411,695 |
| 44 | Faribault | $411,171 |
More Minnesota Salary Data
Senior / Experienced
Top earner salaries for experienced radiologists.
Explore More Radiologist Salary Data
Frequently Asked Questions
How much do radiologists make in Minnesota in 2026?
What is the highest paying city for radiologists in Minnesota?
How does Minnesota radiologist pay compare to the national average?
What is the entry-level radiologist salary in Minnesota?
How many radiologists are employed in Minnesota?
Which Minnesota city offers the best value for radiologists?
Written by Dr. Maria Chen, MD
Career Analyst
Dr. Chen has 10 years of experience in diagnostic radiology. She specializes in imaging techniques for oncology. She works at a regional medical center.
Methodology & Data Source
Statewide salary figures on this page are 2026 projections based on the Bureau of Labor Statistics Occupational Employment and Wage Statistics (OEWS) survey, May 2026 release. A 5.00% compound annual growth rate (CAGR), derived from 6-year national BLS wage trends, was applied to each metro area's reported salary to estimate current 2026 radiologist compensation across Minnesota. State averages are employment-weighted across 44 metro areas — larger metro areas with more radiologistscontribute proportionally more to the average, producing figures that better reflect typical compensation. Individual pay varies by city, employer, certifications, and experience.
Data Sources & Methodology
Source: BLS, OEWS, 2-year dataset (–). Per-city data from annual BLS metropolitan area surveys.
2026 figures are projected from 2025 BLS data using a compound annual growth rate (CAGR) of 5.00%, derived from historical BLS wage trends for radiologists (SOC 29-1224).
Compiled and verified by Dr. Maria Chen, MD, a licensed radiologist with 10+ years of clinical experience. · View source data at BLS.gov