Radiologist Salary in Shakopee, MN: $421,591 (2026)
Quick Answer:A full-time radiologist in Shakopee, MN earns a median $421,591/year (≈ $202.69/hour) in nominal terms for 2026 — projected from BLS OEWS 2025 (SOC 29-1224). Once you factor in Shakopee's price level (1% below national, BEA RPP 98.5), that paycheck buys what $428,011 would nationally. Nominal pay sits 3.1% below the Minnesota state average.
Based on BLS state-level estimates · View source
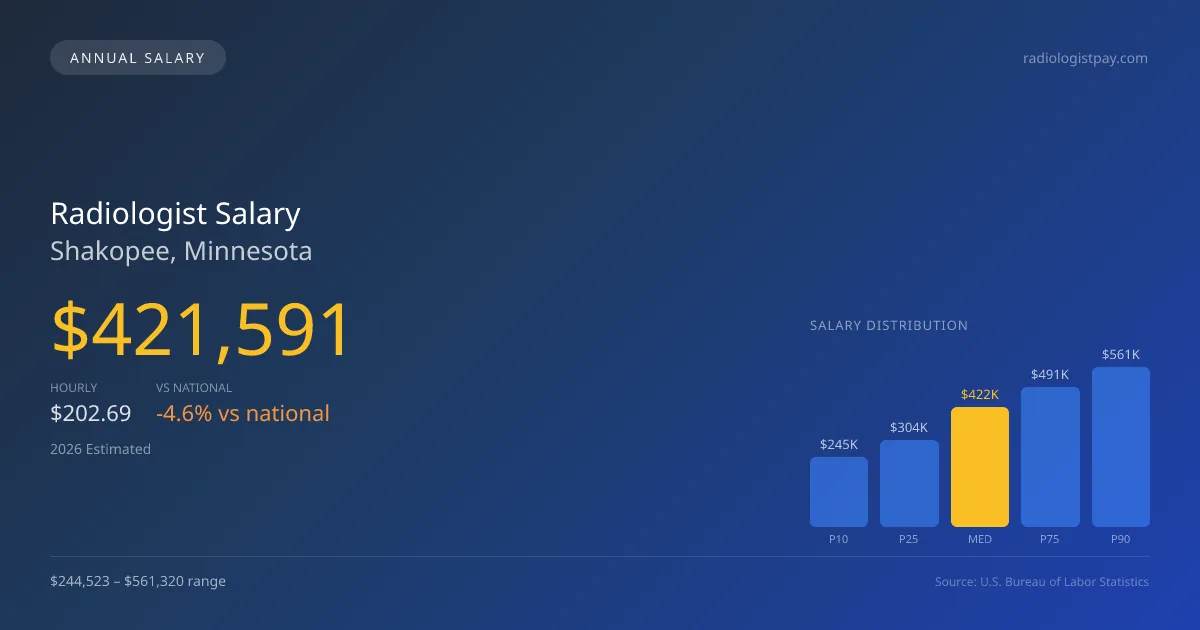
In 2026, radiologists in Shakopee, Minnesota, are projected to earn a median annual salary of $421,591. This figure represents a variance in compensation, with the salary range extending from $244,523 at the 10th percentile to $561,320 at the 90th percentile. These salary estimates are adjusted for regional cost factors based on 2025 BLS data and provide a useful perspective on the local market. Despite a slightly lower median than the national average of $441,903, opportunities in teleradiology can enhance effective hourly compensation for practitioners. Shakopee's job market for radiologists, while moderately competitive with just 11 employed in the area, shows potential for growth amid a robust healthcare sector.
About the Shakopee Market
Salary estimated from Minnesota average ($400,000) adjusted for local cost of living.
Salary Breakdown
| Percentile | Annual | Hourly |
|---|---|---|
| Entry Level (P10) | $244,523 | $117.56 |
| Lower Range (P25) | $303,546 | $145.94 |
| Median (P50)(typical) | $421,591 | $202.69 |
| Upper Range (P75) | $491,155 | $236.13 |
| Top Earners (P90) | $561,320 | $269.86 |
Median Salary Position
4.6% below the national average
2026 Salary Percentile Distribution in Shakopee
In Shakopee, MN, the radiologist salary spread from the 10th to 90th percentile is $316,797 (2026 est.). At $421,591, the local median is 4.6% below the national median of $441,903.
Salary Calculator
At 40 hours/week in Shakopee: You'd be above the median
How Shakopee Radiologist Pay Compares
Shakopee median: $421,591/year (2026)
| Compared To | Median Salary | Shakopee Pays |
|---|---|---|
| Minnesota Average | $435,078 | -3.10% less |
| National Average | $441,903 | -4.60% less |
Radiologists in Shakopee, MN earn a median of $421,591 per year (2026 est.), which is 4.60% lower than the national median of $441,903 and 3.10% below the Minnesota state average of $435,078.
Cost-of-Living Adjusted Salary
Shakopee has a cost of living 1.50% below the national average, meaning your salary goes further here.
Adjusted salary = nominal × (100 / CoL index). CoL index: 100 = national average.
Shakopee, MN has a cost-of-living index of 98.5 (below the national average of 100). A radiologist earning $421,591 nominally has purchasing power equivalent to $428,011 in an average-cost city — an effective 1.52% boost.
Compare Purchasing Power
Select a city to see how your salary compares after cost of living
Select a city above to compare purchasing power
2021 BLS Actual
$330,327
2025 BLS Actual
$401,515
2026 Current Est.
$421,591
2021–2027 Growth
+34.0%
Salary Trajectory for Radiologists in Shakopee (2021–2027)
2021–2025: actual BLS OEWS data for this metro area. 2026+: CAGR 5.00% projection.
| Year | Annual Salary | Status |
|---|---|---|
| 2021 | $330,327 | Actual |
| 2022 | $346,844 | Actual |
| 2023 | $364,186 | Actual |
| 2024 | $381,614 | Actual |
| 2025 | $401,515 | Actual |
| 2026(current) | $421,591 | Estimated |
| 2027 | $442,670 | Projected |
Based on 5 years of BLS OEWS data for the Shakopee metropolitan area, the median radiologist salary grew 21.6% from $330,327 (2021) to $401,515 (2025). At a 5.00% compound annual growth rate, salaries are projected to reach $442,670 by 2027 — a total increase of $112,343 (34.01%) from 2021.
Note: Historical values (2021–2025) are actual BLS OEWS figures for the Shakopee metropolitan area, sourced from annual Occupational Employment and Wage Statistics surveys. 2026–2026 figures are current estimates, and 2027 values are projections, calculated using a 5.00% CAGR derived from 5-year BLS historical data. Actual salaries may vary based on employer, experience, certifications, and local market conditions.
Salary by Experience Level
| Experience | Estimated Salary Range |
|---|---|
| 0-2 years (New Graduate) | $244,523 – $303,546 |
| 3-5 years (Mid Career) | $303,546 – $421,591 |
| 5+ years (Experienced) | $421,591 – $491,155 |
| 10+ years (Top Earner) | $491,155 – $561,320 |
MD, DO salary ranges estimated from BLS percentile data. Individual radiologist compensation varies by employer, certifications, and specialization.
Radiologist Job Market in Shakopee
The local job market presents a balanced outlook with 11 practicing radiologists, reflecting both opportunities and competition. The cost of living in Shakopee remains relatively low, with a cost-of-living index of 98.5, which positively impacts the take-home purchasing power for physicians. Most lucrative positions tend to emerge from private radiology groups and teleradiology firms, capitalizing on increasing demands for remote services. Factors that contribute to the variation in pay encompass RVU productivity models, subspecialty skills—especially interventional radiology, which can command premiums of 30-50%—and the distinctions between W-2 employment and partnership models. To maximize income in this market, radiologists should focus on building subspecialty expertise, particularly in high-demand areas, and consider the benefits of moonlighting in teleradiology, which can supplement traditional income streams effectively.
More salary data for Shakopee, MN:
Frequently Asked Questions
How much do radiologists make in Shakopee, MN in 2026?
Is Shakopee, MN a good place to work as a radiologist?
Can radiologists make $100K in Shakopee?
What is the cost-of-living adjusted radiologist salary in Shakopee?
How much does a radiologist make per hour in Shakopee?
Related Pages
Compare Salaries
Career Resources
Nearby Cities in Minnesota
Written by Dr. Maria Chen, MD
Career Analyst
Dr. Chen has 10 years of experience in diagnostic radiology. She specializes in imaging techniques for oncology. She works at a regional medical center.
Methodology & Data Source
Salary figures on this page are 2026 projections based on the Bureau of Labor Statistics Occupational Employment and Wage Statistics (OEWS) survey, May 2026 release. The BLS reported a median annual salary of $401,515 for radiologistsin the Shakopee metropolitan area. A 5.00% compound annual growth rate (CAGR), calculated from 6-year national BLS wage trends, was applied to project current 2026 compensation. Percentile ranges (P10–P90) represent the full salary distribution across experience levels and practice settings in this market.
Data Sources & Methodology
Salary data for Shakopee is estimated from official BLS state-level occupational wage data (2025), adjusted for regional cost-of-living differences using BEA RPP (Regional Price Parities).
2026 figures are projected from 2025 BLS data using a compound annual growth rate (CAGR) of 5.00%, derived from historical BLS wage trends for radiologists (SOC 29-1224).
Compiled and verified by Dr. Maria Chen, MD, a licensed radiologist with 10+ years of clinical experience. · View source data at BLS.gov