Radiologist Salary in Burnsville, MN: $429,249 (2026)
Quick Answer:A full-time radiologist in Burnsville, MN earns a median $429,249/year (≈ $206.37/hour) in nominal terms for 2026 — projected from BLS OEWS 2025 (SOC 29-1224). Once you factor in Burnsville's price level (1% below national, BEA RPP 98.5), that paycheck buys what $435,786 would nationally. Nominal pay sits 1.4% below the Minnesota state average.
Based on BLS state-level estimates · View source
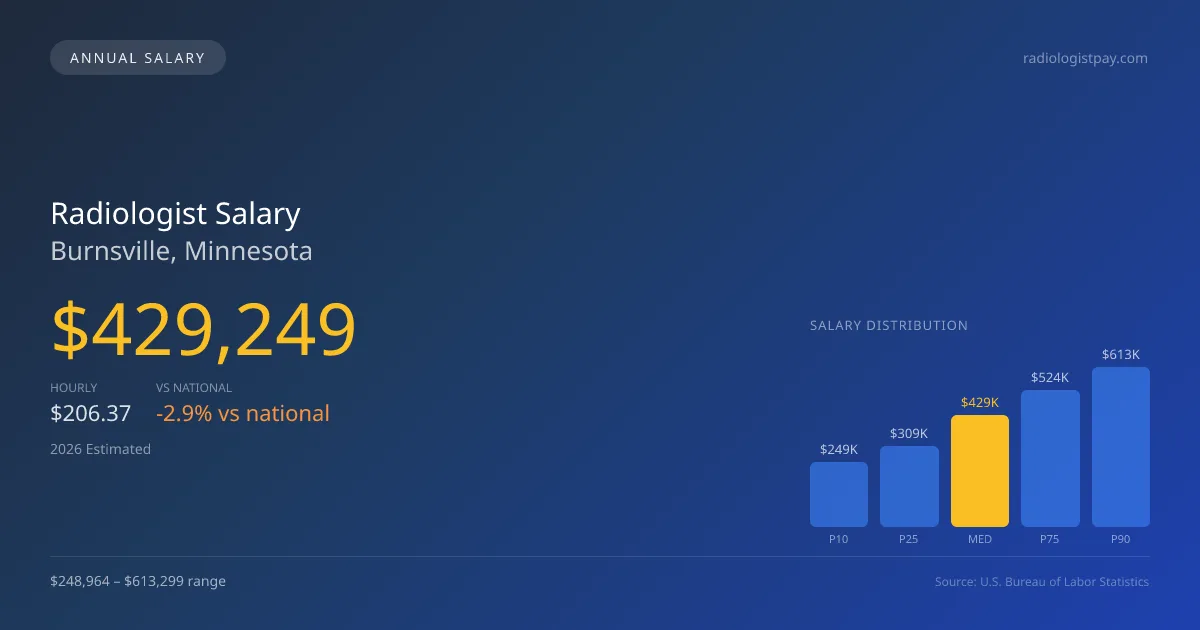
In 2026, radiologists in Burnsville, Minnesota, are projected to earn a median annual salary of $429,249, slightly below the national median of $441,903. The salary range for this profession in the area spans from $248,964 at the 10th percentile to $613,299 at the 90th percentile, indicating a significant disparity in earnings among practitioners. These estimates are derived from 2025 BLS state-level data and adjusted for regional price variations. For radiologists considering teleradiology as a supplementary income stream, effective hourly compensation can be enhanced, particularly during off-peak hours, influencing the overall financial landscape for practitioners in this city.
About the Burnsville Market
Salary estimated from Minnesota average ($400,000) adjusted for local cost of living.
Salary Breakdown
| Percentile | Annual | Hourly |
|---|---|---|
| Entry Level (P10) | $248,964 | $119.69 |
| Lower Range (P25) | $309,059 | $148.59 |
| Median (P50)(typical) | $429,249 | $206.37 |
| Upper Range (P75) | $523,535 | $251.70 |
| Top Earners (P90) | $613,299 | $294.85 |
Median Salary Position
2.86% below the national average
2026 Salary Percentile Distribution in Burnsville
In Burnsville, MN, the radiologist salary spread from the 10th to 90th percentile is $364,335 (2026 est.). At $429,249, the local median is 2.86% below the national median of $441,903.
Salary Calculator
At 40 hours/week in Burnsville: You'd be in the lower-middle range
How Burnsville Radiologist Pay Compares
Burnsville median: $429,249/year (2026)
| Compared To | Median Salary | Burnsville Pays |
|---|---|---|
| Minnesota Average | $435,344 | -1.40% less |
| National Average | $441,903 | -2.86% less |
Radiologists in Burnsville, MN earn a median of $429,249 per year (2026 est.), which is 2.86% lower than the national median of $441,903 and 1.40% below the Minnesota state average of $435,344.
Cost-of-Living Adjusted Salary
Burnsville has a cost of living 1.50% below the national average, meaning your salary goes further here.
Adjusted salary = nominal × (100 / CoL index). CoL index: 100 = national average.
Burnsville, MN has a cost-of-living index of 98.5 (below the national average of 100). A radiologist earning $429,249 nominally has purchasing power equivalent to $435,786 in an average-cost city — an effective 1.52% boost.
Compare Purchasing Power
Select a city to see how your salary compares after cost of living
Select a city above to compare purchasing power
2021 BLS Actual
$336,328
2025 BLS Actual
$408,809
2026 Current Est.
$429,249
2021–2027 Growth
+34.0%
Salary Trajectory for Radiologists in Burnsville (2021–2027)
2021–2025: actual BLS OEWS data for this metro area. 2026+: CAGR 5.00% projection.
| Year | Annual Salary | Status |
|---|---|---|
| 2021 | $336,328 | Actual |
| 2022 | $353,145 | Actual |
| 2023 | $370,802 | Actual |
| 2024 | $388,547 | Actual |
| 2025 | $408,809 | Actual |
| 2026(current) | $429,249 | Estimated |
| 2027 | $450,712 | Projected |
Based on 5 years of BLS OEWS data for the Burnsville metropolitan area, the median radiologist salary grew 21.6% from $336,328 (2021) to $408,809 (2025). At a 5.00% compound annual growth rate, salaries are projected to reach $450,712 by 2027 — a total increase of $114,384 (34.01%) from 2021.
Note: Historical values (2021–2025) are actual BLS OEWS figures for the Burnsville metropolitan area, sourced from annual Occupational Employment and Wage Statistics surveys. 2026–2026 figures are current estimates, and 2027 values are projections, calculated using a 5.00% CAGR derived from 5-year BLS historical data. Actual salaries may vary based on employer, experience, certifications, and local market conditions.
Salary by Experience Level
| Experience | Estimated Salary Range |
|---|---|
| 0-2 years (New Graduate) | $248,964 – $309,059 |
| 3-5 years (Mid Career) | $309,059 – $429,249 |
| 5+ years (Experienced) | $429,249 – $523,535 |
| 10+ years (Top Earner) | $523,535 – $613,299 |
MD, DO salary ranges estimated from BLS percentile data. Individual radiologist compensation varies by employer, certifications, and specialization.
Radiologist Job Market in Burnsville
The job market for radiologists in Burnsville appears relatively stable, with about nine professionals currently employed in the area. Given the cost of living index in Burnsville stands at 98.5, almost two points below the national average, this can affect take-home purchasing power for local radiologists. When evaluating potential employers, private radiology group practices generally offer the most competitive compensation, followed closely by hospital-employed positions and teleradiology firms, which provide additional income opportunities through flexible work arrangements. Factors such as RVU productivity, subspecialty expertise, especially in interventional radiology, and the nature of employment (W-2 vs. partnership) significantly influence pay differences. Understanding local dynamics can help radiologists maximize their earnings potential, emphasizing the importance of negotiating contracts and considering partnerships for long-term financial benefits.
More salary data for Burnsville, MN:
Frequently Asked Questions
How much do radiologists make in Burnsville, MN in 2026?
Is Burnsville, MN a good place to work as a radiologist?
Can radiologists make $100K in Burnsville?
What is the cost-of-living adjusted radiologist salary in Burnsville?
How much does a radiologist make per hour in Burnsville?
Related Pages
Compare Salaries
Career Resources
Nearby Cities in Minnesota
Written by Dr. Maria Chen, MD
Career Analyst
Dr. Chen has 10 years of experience in diagnostic radiology. She specializes in imaging techniques for oncology. She works at a regional medical center.
Methodology & Data Source
Salary figures on this page are 2026 projections based on the Bureau of Labor Statistics Occupational Employment and Wage Statistics (OEWS) survey, May 2026 release. The BLS reported a median annual salary of $408,809 for radiologistsin the Burnsville metropolitan area. A 5.00% compound annual growth rate (CAGR), calculated from 6-year national BLS wage trends, was applied to project current 2026 compensation. Percentile ranges (P10–P90) represent the full salary distribution across experience levels and practice settings in this market.
Data Sources & Methodology
Salary data for Burnsville is estimated from official BLS state-level occupational wage data (2025), adjusted for regional cost-of-living differences using BEA RPP (Regional Price Parities).
2026 figures are projected from 2025 BLS data using a compound annual growth rate (CAGR) of 5.00%, derived from historical BLS wage trends for radiologists (SOC 29-1224).
Compiled and verified by Dr. Maria Chen, MD, a licensed radiologist with 10+ years of clinical experience. · View source data at BLS.gov