Radiologist Salary in West Bend, WI: $405,559 (2026)
Quick Answer:A full-time radiologist in West Bend, WI earns a median $405,559/year (≈ $194.98/hour) in nominal terms for 2026 — projected from BLS OEWS 2025 (SOC 29-1224). Once you factor in West Bend's price level (7% below national, BEA RPP 93.4), that paycheck buys what $434,217 would nationally. Nominal pay sits 1.7% below the Wisconsin state average.
Based on BLS state-level estimates · View source
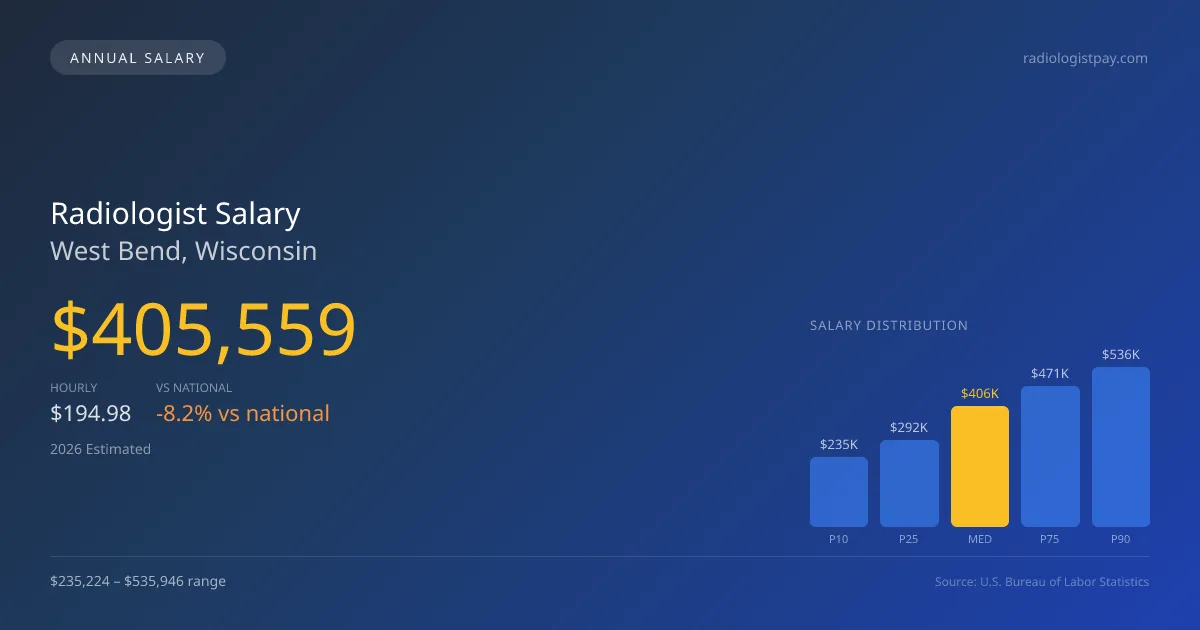
In 2026, the median annual salary for radiologists in West Bend, Wisconsin, is projected to reach $405,559, slightly below the national median of $441,903. The local salary range showcases significant variability as well, spanning from $235,224 at the 10th percentile to $535,946 at the 90th percentile. These figures, derived from 2025 BLS state-level data adjusted for regional cost considerations, reflect a competitive yet nuanced compensation structure influenced by a mix of employment types. Notably, the W-2 employed radiologists in hospital settings often find their earnings lower than their counterparts in private partnerships, where compensation typically hinges on revenue generation and practice productivity. This structural divide impacts how much radiologists can expect to earn in this market.
About the West Bend Market
Salary estimated from Wisconsin average ($390,000) adjusted for local cost of living.
Salary Breakdown
| Percentile | Annual | Hourly |
|---|---|---|
| Entry Level (P10) | $235,224 | $113.09 |
| Lower Range (P25) | $292,003 | $140.38 |
| Median (P50)(typical) | $405,559 | $194.98 |
| Upper Range (P75) | $470,945 | $226.41 |
| Top Earners (P90) | $535,946 | $257.67 |
Median Salary Position
8.22% below the national average
2026 Salary Percentile Distribution in West Bend
In West Bend, WI, the radiologist salary spread from the 10th to 90th percentile is $300,722 (2026 est.). At $405,559, the local median is 8.22% below the national median of $441,903.
Salary Calculator
At 40 hours/week in West Bend: You'd be above the median
How West Bend Radiologist Pay Compares
West Bend median: $405,559/year (2026)
| Compared To | Median Salary | West Bend Pays |
|---|---|---|
| Wisconsin Average | $412,573 | -1.70% less |
| National Average | $441,903 | -8.22% less |
Radiologists in West Bend, WI earn a median of $405,559 per year (2026 est.), which is 8.22% lower than the national median of $441,903 and 1.70% below the Wisconsin state average of $412,573.
Cost-of-Living Adjusted Salary
West Bend has a cost of living 6.60% below the national average, meaning your salary goes further here.
Adjusted salary = nominal × (100 / CoL index). CoL index: 100 = national average.
West Bend, WI has a cost-of-living index of 93.4 (below the national average of 100). A radiologist earning $405,559 nominally has purchasing power equivalent to $434,217 in an average-cost city — an effective 7.07% boost.
Compare Purchasing Power
Select a city to see how your salary compares after cost of living
Select a city above to compare purchasing power
2021 BLS Actual
$317,766
2025 BLS Actual
$386,247
2026 Current Est.
$405,559
2021–2027 Growth
+34.0%
Salary Trajectory for Radiologists in West Bend (2021–2027)
2021–2025: actual BLS OEWS data for this metro area. 2026+: CAGR 5.00% projection.
| Year | Annual Salary | Status |
|---|---|---|
| 2021 | $317,766 | Actual |
| 2022 | $333,655 | Actual |
| 2023 | $350,337 | Actual |
| 2024 | $357,926 | Actual |
| 2025 | $386,247 | Actual |
| 2026(current) | $405,559 | Estimated |
| 2027 | $425,837 | Projected |
Based on 5 years of BLS OEWS data for the West Bend metropolitan area, the median radiologist salary grew 21.6% from $317,766 (2021) to $386,247 (2025). At a 5.00% compound annual growth rate, salaries are projected to reach $425,837 by 2027 — a total increase of $108,071 (34.01%) from 2021.
Note: Historical values (2021–2025) are actual BLS OEWS figures for the West Bend metropolitan area, sourced from annual Occupational Employment and Wage Statistics surveys. 2026–2026 figures are current estimates, and 2027 values are projections, calculated using a 5.00% CAGR derived from 5-year BLS historical data. Actual salaries may vary based on employer, experience, certifications, and local market conditions.
Salary by Experience Level
| Experience | Estimated Salary Range |
|---|---|
| 0-2 years (New Graduate) | $235,224 – $292,003 |
| 3-5 years (Mid Career) | $292,003 – $405,559 |
| 5+ years (Experienced) | $405,559 – $470,945 |
| 10+ years (Top Earner) | $470,945 – $535,946 |
MD, DO salary ranges estimated from BLS percentile data. Individual radiologist compensation varies by employer, certifications, and specialization.
Radiologist Job Market in West Bend
Five radiologists are currently employed in West Bend, indicating a compact but potentially lucrative job market for those who specialize in this field. The local cost of living index stands at 93.4, suggesting that while salary figures may be slightly lower than national averages, they still provide a favorable purchasing power for residents. Among local employers, private radiology group practices tend to offer the highest compensation, reflecting the appeal of partnership models that reward RVU productivity and specialization, especially for interventional radiologists whose skills can command a significant premium. Factors such as weekend and night call coverage can further enhance income prospects, while teleradiology opportunities may serve as valuable supplementary income streams. Radiologists aiming to maximize pay in West Bend should consider the benefits of pursuing partnerships over W-2 positions, as well as further specializing in high-demand areas to boost earning potential.
More salary data for West Bend, WI:
Frequently Asked Questions
How much do radiologists make in West Bend, WI in 2026?
Is West Bend, WI a good place to work as a radiologist?
Can radiologists make $100K in West Bend?
What is the cost-of-living adjusted radiologist salary in West Bend?
How much does a radiologist make per hour in West Bend?
Related Pages
Compare Salaries
Career Resources
Nearby Cities in Wisconsin
Written by Dr. Maria Chen, MD
Career Analyst
Dr. Chen has 10 years of experience in diagnostic radiology. She specializes in imaging techniques for oncology. She works at a regional medical center.
Methodology & Data Source
Salary figures on this page are 2026 projections based on the Bureau of Labor Statistics Occupational Employment and Wage Statistics (OEWS) survey, May 2026 release. The BLS reported a median annual salary of $386,247 for radiologistsin the West Bend metropolitan area. A 5.00% compound annual growth rate (CAGR), calculated from 6-year national BLS wage trends, was applied to project current 2026 compensation. Percentile ranges (P10–P90) represent the full salary distribution across experience levels and practice settings in this market.
Data Sources & Methodology
Salary data for West Bend is estimated from official BLS state-level occupational wage data (2025), adjusted for regional cost-of-living differences using BEA RPP (Regional Price Parities).
2026 figures are projected from 2025 BLS data using a compound annual growth rate (CAGR) of 5.00%, derived from historical BLS wage trends for radiologists (SOC 29-1224).
Compiled and verified by Dr. Maria Chen, MD, a licensed radiologist with 10+ years of clinical experience. · View source data at BLS.gov