Radiologist Salary in Wisconsin: $370,774 (2026)
Quick Answer:Across Wisconsin's 46 metropolitan areas, the average median radiologist pay sits at $370,774/year heading into 2026 — a figure projected from 2025 BLS OEWS wage data for SOC 29-1224. Because Wisconsin sits at BEA RPP 93.4 (7% below the U.S. baseline), that statewide median translates to roughly $396,974 in nationally-comparable purchasing power. Highest-paying metros: Milwaukee ($431,781), Green Bay ($402,397), Eau Claire ($397,044).
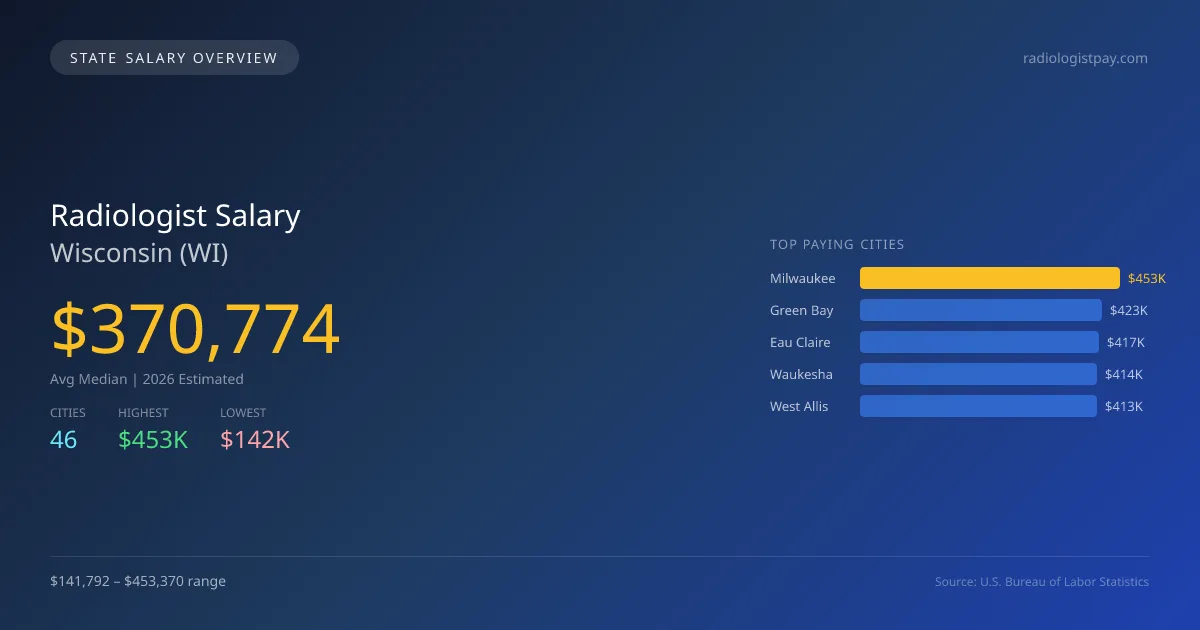
In 2026, the average median salary for radiologists in Wisconsin is projected to be $370,774, which is significantly lower than the national median of $441,903, reflecting a difference of -16.1%. The highest-paying city, Milwaukee, offers a salary of $453,370, whereas the lowest, Madison, has a considerably lower salary of $141,792, illustrating a notable disparity of $311,578 between the two cities. This difference is driven by factors such as cost of living, the local demand for medical professionals, and the concentration of healthcare facilities. The state of Wisconsin has specific licensing requirements and scope of practice laws that affect the work environment for radiologists. With 562 radiologists employed in the state and a projected job growth rate of 5.00% annually, the demand for professionals in this field remains strong. Major cities like Green Bay ($422,517), Eau Claire ($416,896), Waukesha ($413,758), and West Allis ($413,072) provide competitive salaries, suggesting a vibrant job market for radiologists. Understanding these regional nuances can help you make informed career decisions in the field of radiology within Wisconsin.
Wisconsin Radiologist Salary Range
Overall salary range in Wisconsin: $85,008 (lowest entry-level) to $705,359 (highest top earner)
Wisconsin vs National Average
Wisconsin radiologists earn 16.1% less than the national median ($-71,129/year difference).
Wisconsin Radiologist Salary Distribution (2026)
Radiologist salaries in Wisconsin range from $215,492 (entry-level, 10th percentile) to $597,466 (top earners, 90th percentile), with a median of $370,774. The Wisconsin median is $71,129 below the US national median of $441,903. The average hourly rate is $178.26/hr. Approximately 562 radiologists are employed across 46 cities.
2021 BLS Actual
$290,511
2025 BLS Actual
$353,118
2026 Current Est.
$370,774
2021–2027 Growth
+34.0%
Salary Trajectory for Radiologists in Wisconsin (2021–2027)
2021–2025: actual BLS OEWS data for this metro area. 2026+: CAGR 5.00% projection.
| Year | Annual Salary | Status |
|---|---|---|
| 2021 | $290,511 | Actual |
| 2022 | $305,037 | Actual |
| 2023 | $320,289 | Actual |
| 2024 | $366,414 | Actual |
| 2025 | $353,118 | Actual |
| 2026(current) | $370,774 | Estimated |
| 2027 | $389,313 | Projected |
Based on 5 years of BLS OEWS data for the Wisconsin metropolitan area, the median radiologist salary grew 21.6% from $290,511 (2021) to $353,118 (2025). At a 5.00% compound annual growth rate, salaries are projected to reach $389,313 by 2027 — a total increase of $98,802 (34.01%) from 2021.
Note: Historical values (2021–2025) are actual BLS OEWS figures for the Wisconsin metropolitan area, sourced from annual Occupational Employment and Wage Statistics surveys. 2026–2026 figures are current estimates, and 2027 values are projections, calculated using a 5.00% CAGR derived from 5-year BLS historical data. Actual salaries may vary based on employer, experience, certifications, and local market conditions.
Top 5 Highest Paying Cities in Wisconsin
Lowest Paying Cities in Wisconsin
| City | Median Salary |
|---|---|
| Madison | $141,792 |
| Wisconsin Rapids | $378,428 |
| Middleton | $381,594 |
| Platteville | $385,691 |
| Mequon | $385,723 |
Best Value Cities for Radiologists in Wisconsin
When adjusted for local cost of living, these Wisconsin cities offer the most purchasing power for radiologists.
| City | Nominal Salary | CoL Index | Adjusted Salary |
|---|---|---|---|
| Milwaukee | $453,370 | 93.4 | $485,407 |
| Green Bay | $422,517 | 93.4 | $452,374 |
| Eau Claire | $416,896 | 93.4 | $446,355 |
| Waukesha | $413,758 | 93.4 | $442,996 |
| West Allis | $413,072 | 93.4 | $442,261 |
Adjusted salary = nominal salary × (100 / CoL index). CoL index: 100 = national average. Lower index = lower cost of living.
Salary by Experience Level in Wisconsin
| Experience Level | Estimated Annual |
|---|---|
| Entry Level (0-2 years) | $215,492 |
| Mid Career (3-7 years) | $370,774 |
| Experienced (7+ years) | $597,466 |
Estimates based on BLS percentile data averaged across Wisconsin metro areas. Individual pay varies by employer, certifications, and specialization.
All 46 Cities in Wisconsin
| # | City | Median Salary |
|---|---|---|
| 1 | Milwaukee | $453,370 |
| 2 | Green Bay | $422,517 |
| 3 | Eau Claire | $416,896 |
| 4 | Waukesha | $413,758 |
| 5 | West Allis | $413,072 |
| 6 | Fitchburg | $410,332 |
| 7 | Greenfield | $410,300 |
| 8 | Kenosha | $409,346 |
| 9 | Appleton | $407,940 |
| 10 | Racine | $407,220 |
| 11 | Oshkosh | $406,861 |
| 12 | Menomonee Falls | $406,745 |
| 13 | Brookfield | $405,784 |
| 14 | West Bend | $405,559 |
| 15 | De Pere | $405,239 |
| 16 | New Berlin | $404,471 |
| 17 | Wausau | $401,300 |
| 18 | Beloit | $401,268 |
| 19 | Sun Prairie | $401,043 |
| 20 | Caledonia | $399,954 |
| 21 | Mount Pleasant | $399,762 |
| 22 | Janesville | $399,113 |
| 23 | Muskego | $399,090 |
| 24 | La Crosse | $398,951 |
| 25 | Stevens Point | $397,232 |
| 26 | Franklin | $396,783 |
| 27 | Oak Creek | $395,535 |
| 28 | Superior | $394,926 |
| 29 | Manitowoc | $394,734 |
| 30 | Sheboygan | $394,414 |
| 31 | Fond du Lac | $393,517 |
| 32 | Pewaukee | $393,265 |
| 33 | Onalaska | $393,171 |
| 34 | South Milwaukee | $392,116 |
| 35 | Pleasant Prairie | $392,054 |
| 36 | Menomonie | $391,651 |
| 37 | Whitewater | $391,620 |
| 38 | Wauwatosa | $391,275 |
| 39 | Germantown | $390,999 |
| 40 | Marshfield | $390,844 |
| 41 | River Falls | $388,920 |
| 42 | Mequon | $385,723 |
| 43 | Platteville | $385,691 |
| 44 | Middleton | $381,594 |
| 45 | Wisconsin Rapids | $378,428 |
| 46 | Madison | $141,792 |
More Wisconsin Salary Data
Senior / Experienced
Top earner salaries for experienced radiologists.
Compare Cities in Wisconsin
View all comparisons →Explore More Radiologist Salary Data
Frequently Asked Questions
How much do radiologists make in Wisconsin in 2026?
What is the highest paying city for radiologists in Wisconsin?
How does Wisconsin radiologist pay compare to the national average?
What is the entry-level radiologist salary in Wisconsin?
How many radiologists are employed in Wisconsin?
Which Wisconsin city offers the best value for radiologists?
Written by Dr. Maria Chen, MD
Career Analyst
Dr. Chen has 10 years of experience in diagnostic radiology. She specializes in imaging techniques for oncology. She works at a regional medical center.
Methodology & Data Source
Statewide salary figures on this page are 2026 projections based on the Bureau of Labor Statistics Occupational Employment and Wage Statistics (OEWS) survey, May 2026 release. A 5.00% compound annual growth rate (CAGR), derived from 6-year national BLS wage trends, was applied to each metro area's reported salary to estimate current 2026 radiologist compensation across Wisconsin. State averages are employment-weighted across 46 metro areas — larger metro areas with more radiologistscontribute proportionally more to the average, producing figures that better reflect typical compensation. Individual pay varies by city, employer, certifications, and experience.
Data Sources & Methodology
Source: BLS, OEWS, 2-year dataset (–). Per-city data from annual BLS metropolitan area surveys.
2026 figures are projected from 2025 BLS data using a compound annual growth rate (CAGR) of 5.00%, derived from historical BLS wage trends for radiologists (SOC 29-1224).
Compiled and verified by Dr. Maria Chen, MD, a licensed radiologist with 10+ years of clinical experience. · View source data at BLS.gov