Radiologist Salary in Sterling, VA: $471,995 (2026)
Quick Answer:A full-time radiologist in Sterling, VA earns a median $471,995/year (≈ $226.92/hour) in nominal terms for 2026 — projected from BLS OEWS 2025 (SOC 29-1224). Once you factor in Sterling's price level (3% above national, BEA RPP 103.2), that paycheck buys what $457,359 would nationally. Nominal pay sits 4.1% below the Virginia state average.
Based on BLS state-level estimates · View source
In 2026, radiologists in Sterling, Virginia, are projected to earn a median annual salary of $471,995, placing them above the national average and reflecting the region's unique compensation structures. With a salary range extending from $273,757 at the 10th percentile to $648,940 at the 90th percentile, the variance is significant, particularly due to the local market's competitive dynamic between private partnerships and hospital employment. These figures, based on 2025 BLS state-level data and adjusted for regional price parities, illustrate how the structure of pay in Sterling is impacted by the type of employment, whether in private practice or hospital settings. In a market where strategic partnerships with private radiology groups often yield higher earnings, understanding the local job landscape is critical for physicians evaluating their career options.
About the Sterling Market
Salary estimated from Virginia average ($380,000) adjusted for local cost of living.
Salary Breakdown
| Percentile | Annual | Hourly |
|---|---|---|
| Entry Level (P10) | $273,757 | $131.62 |
| Lower Range (P25) | $339,837 | $163.38 |
| Median (P50)(typical) | $471,995 | $226.92 |
| Upper Range (P75) | $562,373 | $270.38 |
| Top Earners (P90) | $648,940 | $311.99 |
Median Salary Position
6.81% above the national average
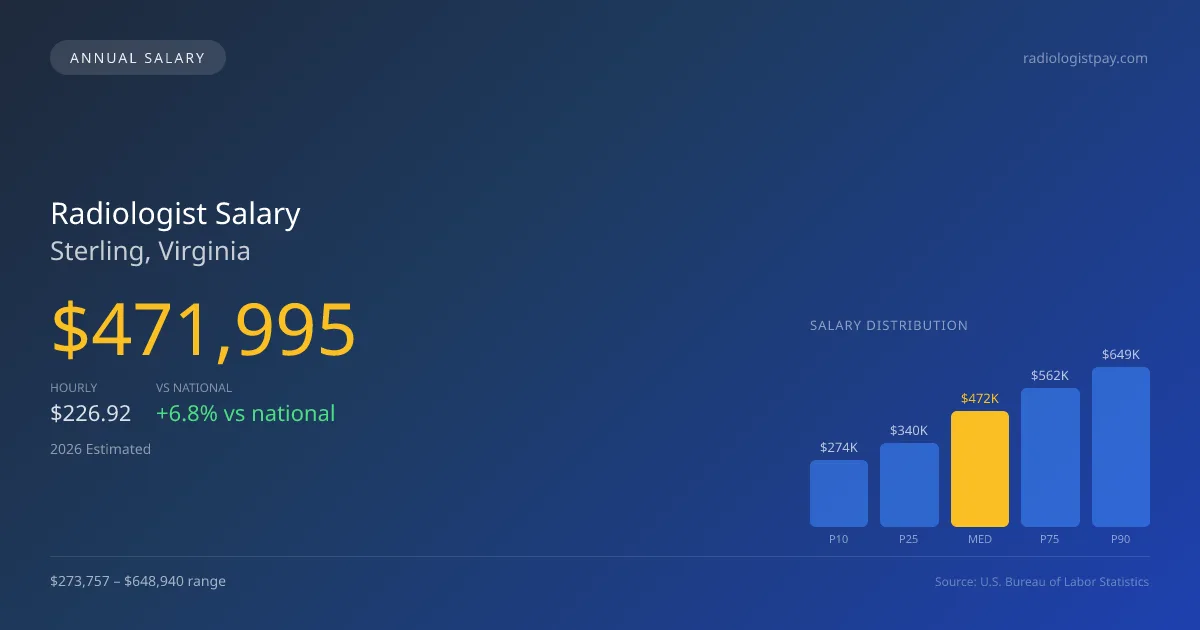
2026 Salary Percentile Distribution in Sterling
In Sterling, VA, the radiologist salary spread from the 10th to 90th percentile is $375,183 (2026 est.). At $471,995, the local median is 6.81% above the national median of $441,903.
Salary Calculator
At 40 hours/week in Sterling: You'd be above the median
How Sterling Radiologist Pay Compares
Sterling median: $471,995/year (2026)
| Compared To | Median Salary | Sterling Pays |
|---|---|---|
| Virginia Average | $492,174 | -4.10% less |
| National Average | $441,903 | +6.81% more |
Radiologists in Sterling, VA earn a median of $471,995 per year (2026 est.), which is 6.81% higher than the national median of $441,903 and 4.10% below the Virginia state average of $492,174.
Cost-of-Living Adjusted Salary
Sterling has a cost of living 3.20% above the national average.
Adjusted salary = nominal × (100 / CoL index). CoL index: 100 = national average.
Sterling, VA has a cost-of-living index of 103.2 (above the national average of 100). While the nominal salary of $471,995 is competitive, the higher cost of living reduces purchasing power to an effective $457,359 — a 3.1% reduction.
Compare Purchasing Power
Select a city to see how your salary compares after cost of living
Select a city above to compare purchasing power
2021 BLS Actual
$369,820
2025 BLS Actual
$449,519
2026 Current Est.
$471,995
2021–2027 Growth
+34.0%
Salary Trajectory for Radiologists in Sterling (2021–2027)
2021–2025: actual BLS OEWS data for this metro area. 2026+: CAGR 5.00% projection.
| Year | Annual Salary | Status |
|---|---|---|
| 2021 | $369,820 | Actual |
| 2022 | $388,311 | Actual |
| 2023 | $407,727 | Actual |
| 2024 | $376,272 | Actual |
| 2025 | $449,519 | Actual |
| 2026(current) | $471,995 | Estimated |
| 2027 | $495,595 | Projected |
Based on 5 years of BLS OEWS data for the Sterling metropolitan area, the median radiologist salary grew 21.6% from $369,820 (2021) to $449,519 (2025). At a 5.00% compound annual growth rate, salaries are projected to reach $495,595 by 2027 — a total increase of $125,775 (34.01%) from 2021.
Note: Historical values (2021–2025) are actual BLS OEWS figures for the Sterling metropolitan area, sourced from annual Occupational Employment and Wage Statistics surveys. 2026–2026 figures are current estimates, and 2027 values are projections, calculated using a 5.00% CAGR derived from 5-year BLS historical data. Actual salaries may vary based on employer, experience, certifications, and local market conditions.
Salary by Experience Level
| Experience | Estimated Salary Range |
|---|---|
| 0-2 years (New Graduate) | $273,757 – $339,837 |
| 3-5 years (Mid Career) | $339,837 – $471,995 |
| 5+ years (Experienced) | $471,995 – $562,373 |
| 10+ years (Top Earner) | $562,373 – $648,940 |
MD, DO salary ranges estimated from BLS percentile data. Individual radiologist compensation varies by employer, certifications, and specialization.
Radiologist Job Market in Sterling
The radiologist job market in Sterling consists of only seven professionals, emphasizing a niche community where competition for top-tier roles can drive salary negotiations. The cost of living index at 103.2 suggests that, while salaries are competitive, radiologists must consider their take-home purchasing power in Greater Washington, D.C. region. Employers, such as private radiology partnerships and hospital W-2 departments, influence compensation levels significantly, with partnership roles often providing higher income potential due to RVU productivity structures and the added benefits of night and weekend teleradiology work. To maximize earnings in this environment, radiologists should explore opportunities for subspecialization—particularly in interventional radiology, which commands a notable premium—as well as negotiating for equity stakes in partnerships. Balancing practice in higher-paying sectors with the realities of hospital employment could strategically enhance their overall earnings in this competitive Virginia market.
More salary data for Sterling, VA:
Frequently Asked Questions
How much do radiologists make in Sterling, VA in 2026?
Is Sterling, VA a good place to work as a radiologist?
Can radiologists make $100K in Sterling?
What is the cost-of-living adjusted radiologist salary in Sterling?
How much does a radiologist make per hour in Sterling?
Related Pages
Compare Salaries
Career Resources
Nearby Cities in Virginia
Written by Dr. Maria Chen, MD
Career Analyst
Dr. Chen has 10 years of experience in diagnostic radiology. She specializes in imaging techniques for oncology. She works at a regional medical center.
Methodology & Data Source
Salary figures on this page are 2026 projections based on the Bureau of Labor Statistics Occupational Employment and Wage Statistics (OEWS) survey, May 2026 release. The BLS reported a median annual salary of $449,519 for radiologistsin the Sterling metropolitan area. A 5.00% compound annual growth rate (CAGR), calculated from 6-year national BLS wage trends, was applied to project current 2026 compensation. Percentile ranges (P10–P90) represent the full salary distribution across experience levels and practice settings in this market.
Data Sources & Methodology
Salary data for Sterling is estimated from official BLS state-level occupational wage data (2025), adjusted for regional cost-of-living differences using BEA RPP (Regional Price Parities).
2026 figures are projected from 2025 BLS data using a compound annual growth rate (CAGR) of 5.00%, derived from historical BLS wage trends for radiologists (SOC 29-1224).
Compiled and verified by Dr. Maria Chen, MD, a licensed radiologist with 10+ years of clinical experience. · View source data at BLS.gov