Radiologist Salary in Norfolk, VA: $514,243 (2026)
Quick Answer:A full-time radiologist in Norfolk, VA earns a median $514,243/year (≈ $247.23/hour) in nominal terms for 2026 — projected from BLS OEWS 2025 (SOC 29-1224). Once you factor in Norfolk's price level (3% above national, BEA RPP 103.2), that paycheck buys what $498,297 would nationally. Nominal pay sits 4.5% above the Virginia state average.
Based on BLS state-level estimates · View source
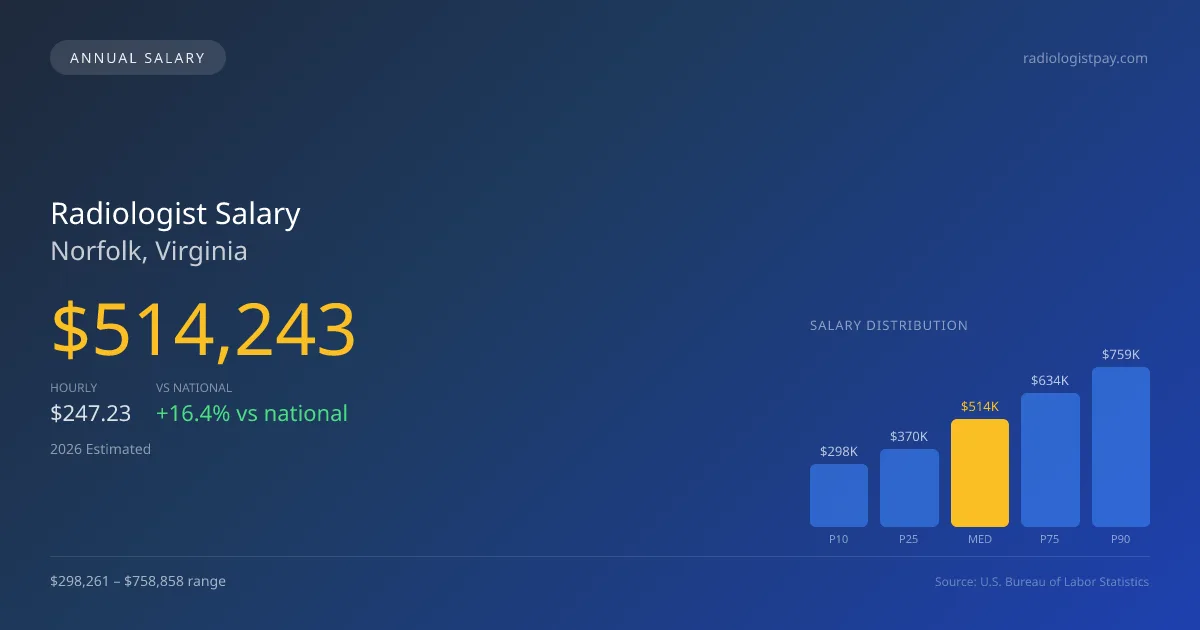
In Norfolk, Virginia, the median annual radiologist salary is projected to reach $514,243 in 2026, exceeding the national median of $441,903 by 16.37%. Compensation ranges significantly from $298,261 at the lower end (10th percentile) to $758,858 at the top (90th percentile). These figures, derived from 2025 BLS data and adjusted for regional cost variations, reflect a diverse specialties mix, with interventional radiology potentially commanding higher pay compared to general diagnostics or breast imaging roles. As the demand for radiology services continues to grow in the area, this upward trend in salary suggests a competitive job market where radiologists can negotiate favorable terms based on their subspecialization.
About the Norfolk Market
Salary estimated from Virginia average ($380,000) adjusted for local cost of living.
Salary Breakdown
| Percentile | Annual | Hourly |
|---|---|---|
| Entry Level (P10) | $298,261 | $143.40 |
| Lower Range (P25) | $370,255 | $178.01 |
| Median (P50)(typical) | $514,243 | $247.23 |
| Upper Range (P75) | $633,681 | $304.66 |
| Top Earners (P90) | $758,858 | $364.83 |
Median Salary Position
16.37% above the national average
2026 Salary Percentile Distribution in Norfolk
In Norfolk, VA, the radiologist salary spread from the 10th to 90th percentile is $460,597 (2026 est.). At $514,243, the local median is 16.37% above the national median of $441,903.
Salary Calculator
At 40 hours/week in Norfolk: You'd be in the lower-middle range
How Norfolk Radiologist Pay Compares
Norfolk median: $514,243/year (2026)
| Compared To | Median Salary | Norfolk Pays |
|---|---|---|
| Virginia Average | $492,098 | +4.50% more |
| National Average | $441,903 | +16.37% more |
Radiologists in Norfolk, VA earn a median of $514,243 per year (2026 est.), which is 16.37% higher than the national median of $441,903 and 4.50% above the Virginia state average of $492,098.
Cost-of-Living Adjusted Salary
Norfolk has a cost of living 3.20% above the national average.
Adjusted salary = nominal × (100 / CoL index). CoL index: 100 = national average.
Norfolk, VA has a cost-of-living index of 103.2 (above the national average of 100). While the nominal salary of $514,243 is competitive, the higher cost of living reduces purchasing power to an effective $498,297 — a 3.1% reduction.
Compare Purchasing Power
Select a city to see how your salary compares after cost of living
Select a city above to compare purchasing power
2021 BLS Actual
$402,923
2025 BLS Actual
$489,755
2026 Current Est.
$514,243
2021–2027 Growth
+34.0%
Salary Trajectory for Radiologists in Norfolk (2021–2027)
2021–2025: actual BLS OEWS data for this metro area. 2026+: CAGR 5.00% projection.
| Year | Annual Salary | Status |
|---|---|---|
| 2021 | $402,923 | Actual |
| 2022 | $423,069 | Actual |
| 2023 | $444,222 | Actual |
| 2024 | $409,951 | Actual |
| 2025 | $489,755 | Actual |
| 2026(current) | $514,243 | Estimated |
| 2027 | $539,955 | Projected |
Based on 5 years of BLS OEWS data for the Norfolk metropolitan area, the median radiologist salary grew 21.6% from $402,923 (2021) to $489,755 (2025). At a 5.00% compound annual growth rate, salaries are projected to reach $539,955 by 2027 — a total increase of $137,032 (34.01%) from 2021.
Note: Historical values (2021–2025) are actual BLS OEWS figures for the Norfolk metropolitan area, sourced from annual Occupational Employment and Wage Statistics surveys. 2026–2026 figures are current estimates, and 2027 values are projections, calculated using a 5.00% CAGR derived from 5-year BLS historical data. Actual salaries may vary based on employer, experience, certifications, and local market conditions.
Salary by Experience Level
| Experience | Estimated Salary Range |
|---|---|
| 0-2 years (New Graduate) | $298,261 – $370,255 |
| 3-5 years (Mid Career) | $370,255 – $514,243 |
| 5+ years (Experienced) | $514,243 – $633,681 |
| 10+ years (Top Earner) | $633,681 – $758,858 |
MD, DO salary ranges estimated from BLS percentile data. Individual radiologist compensation varies by employer, certifications, and specialization.
Radiologist Job Market in Norfolk
In Norfolk, 54 radiologists contribute to a robust healthcare market. While the cost of living index stands at 103.2, slightly above the national average, this affects take-home purchasing power and should be considered when evaluating radiologist pay in Norfolk VA. Traditionally, private radiology group practices and hospital-employed departments tend to offer the highest salaries, though partnerships potentially lead to better long-term financial gains through equity stakes. The disparity in compensation often reflects factors such as RVU productivity, subspecialty expertise, and the additional income opportunities presented by teleradiology. For radiologists aiming to enhance their earnings, focusing on high-demand subspecialties like interventional radiology and considering a shift towards private practice could be key strategies in maximizing pay within this specific market.
More salary data for Norfolk, VA:
Frequently Asked Questions
How much do radiologists make in Norfolk, VA in 2026?
Is Norfolk, VA a good place to work as a radiologist?
Can radiologists make $100K in Norfolk?
What is the cost-of-living adjusted radiologist salary in Norfolk?
How much does a radiologist make per hour in Norfolk?
Related Pages
Compare Salaries
Career Resources
Nearby Cities in Virginia
Written by Dr. Maria Chen, MD
Career Analyst
Dr. Chen has 10 years of experience in diagnostic radiology. She specializes in imaging techniques for oncology. She works at a regional medical center.
Methodology & Data Source
Salary figures on this page are 2026 projections based on the Bureau of Labor Statistics Occupational Employment and Wage Statistics (OEWS) survey, May 2026 release. The BLS reported a median annual salary of $489,755 for radiologistsin the Norfolk metropolitan area. A 5.00% compound annual growth rate (CAGR), calculated from 6-year national BLS wage trends, was applied to project current 2026 compensation. Percentile ranges (P10–P90) represent the full salary distribution across experience levels and practice settings in this market.
Data Sources & Methodology
Salary data for Norfolk is estimated from official BLS state-level occupational wage data (2025), adjusted for regional cost-of-living differences using BEA RPP (Regional Price Parities).
2026 figures are projected from 2025 BLS data using a compound annual growth rate (CAGR) of 5.00%, derived from historical BLS wage trends for radiologists (SOC 29-1224).
Compiled and verified by Dr. Maria Chen, MD, a licensed radiologist with 10+ years of clinical experience. · View source data at BLS.gov