Radiologist Salary in Portsmouth, VA: $476,000 (2026)
Quick Answer:A full-time radiologist in Portsmouth, VA earns a median $476,000/year (≈ $228.85/hour) in nominal terms for 2026 — projected from BLS OEWS 2025 (SOC 29-1224). Once you factor in Portsmouth's price level (3% above national, BEA RPP 103.2), that paycheck buys what $461,240 would nationally. Nominal pay sits 3.2% below the Virginia state average.
Based on BLS state-level estimates · View source
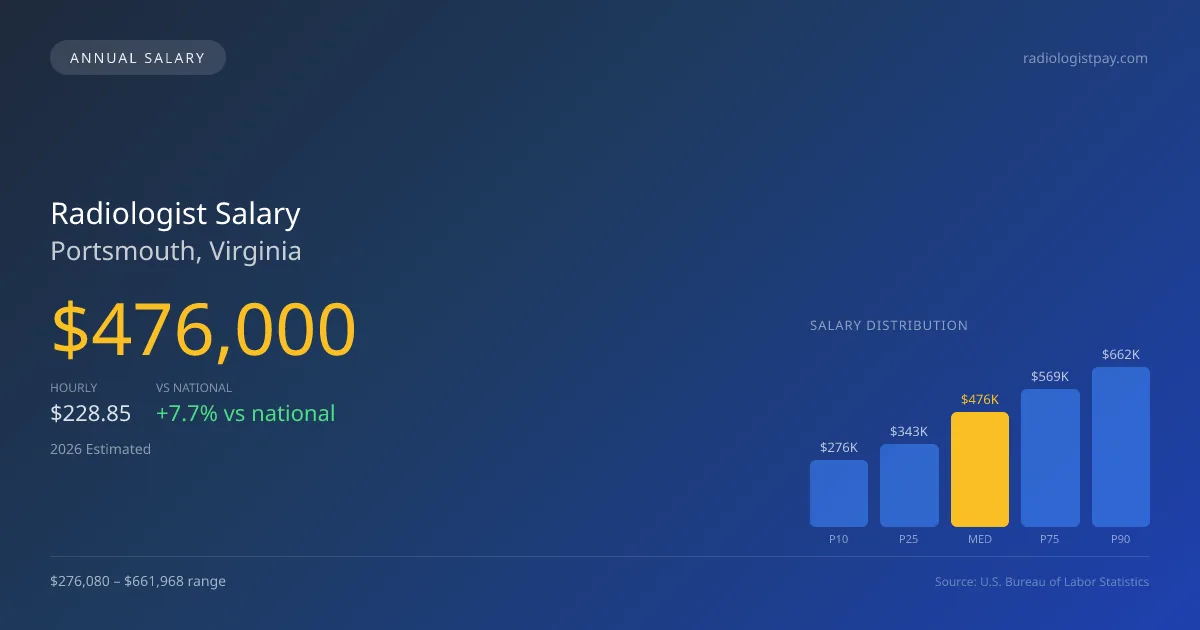
Radiologists in Portsmouth, Virginia, can expect a median annual salary of $476,000 in 2026, positioning the local pay approximately 7.72% higher than the national median of $441,903. The estimated salary range for this specialty spans from $276,080 at the 10th percentile to $661,968 at the 90th percentile, reflecting varied experiences and subspecialties within the field. These figures are based on 2025 BLS data, projected to 2026, and adjusted for regional cost variations. The prevalence of teleradiology as a supplemental income source could further enhance effective hourly compensation, particularly for those providing critical after-hours services. Given the robust demand for radiology services in the region, Portsmouth offers competitive remuneration opportunities that warrant consideration.
About the Portsmouth Market
Salary estimated from Virginia average ($380,000) adjusted for local cost of living.
Salary Breakdown
| Percentile | Annual | Hourly |
|---|---|---|
| Entry Level (P10) | $276,080 | $132.73 |
| Lower Range (P25) | $342,720 | $164.77 |
| Median (P50)(typical) | $476,000 | $228.85 |
| Upper Range (P75) | $569,313 | $273.70 |
| Top Earners (P90) | $661,968 | $318.26 |
Median Salary Position
7.72% above the national average
2026 Salary Percentile Distribution in Portsmouth
In Portsmouth, VA, the radiologist salary spread from the 10th to 90th percentile is $385,888 (2026 est.). At $476,000, the local median is 7.72% above the national median of $441,903.
Salary Calculator
At 40 hours/week in Portsmouth: You'd be above the median
How Portsmouth Radiologist Pay Compares
Portsmouth median: $476,000/year (2026)
| Compared To | Median Salary | Portsmouth Pays |
|---|---|---|
| Virginia Average | $491,735 | -3.20% less |
| National Average | $441,903 | +7.72% more |
Radiologists in Portsmouth, VA earn a median of $476,000 per year (2026 est.), which is 7.72% higher than the national median of $441,903 and 3.20% below the Virginia state average of $491,735.
Cost-of-Living Adjusted Salary
Portsmouth has a cost of living 3.20% above the national average.
Adjusted salary = nominal × (100 / CoL index). CoL index: 100 = national average.
Portsmouth, VA has a cost-of-living index of 103.2 (above the national average of 100). While the nominal salary of $476,000 is competitive, the higher cost of living reduces purchasing power to an effective $461,240 — a 3.1% reduction.
Compare Purchasing Power
Select a city to see how your salary compares after cost of living
Select a city above to compare purchasing power
2021 BLS Actual
$372,958
2025 BLS Actual
$453,333
2026 Current Est.
$476,000
2021–2027 Growth
+34.0%
Salary Trajectory for Radiologists in Portsmouth (2021–2027)
2021–2025: actual BLS OEWS data for this metro area. 2026+: CAGR 5.00% projection.
| Year | Annual Salary | Status |
|---|---|---|
| 2021 | $372,958 | Actual |
| 2022 | $391,606 | Actual |
| 2023 | $411,186 | Actual |
| 2024 | $379,464 | Actual |
| 2025 | $453,333 | Actual |
| 2026(current) | $476,000 | Estimated |
| 2027 | $499,800 | Projected |
Based on 5 years of BLS OEWS data for the Portsmouth metropolitan area, the median radiologist salary grew 21.6% from $372,958 (2021) to $453,333 (2025). At a 5.00% compound annual growth rate, salaries are projected to reach $499,800 by 2027 — a total increase of $126,842 (34.01%) from 2021.
Note: Historical values (2021–2025) are actual BLS OEWS figures for the Portsmouth metropolitan area, sourced from annual Occupational Employment and Wage Statistics surveys. 2026–2026 figures are current estimates, and 2027 values are projections, calculated using a 5.00% CAGR derived from 5-year BLS historical data. Actual salaries may vary based on employer, experience, certifications, and local market conditions.
Salary by Experience Level
| Experience | Estimated Salary Range |
|---|---|
| 0-2 years (New Graduate) | $276,080 – $342,720 |
| 3-5 years (Mid Career) | $342,720 – $476,000 |
| 5+ years (Experienced) | $476,000 – $569,313 |
| 10+ years (Top Earner) | $569,313 – $661,968 |
MD, DO salary ranges estimated from BLS percentile data. Individual radiologist compensation varies by employer, certifications, and specialization.
Radiologist Job Market in Portsmouth
Within Portsmouth, the local job market is relatively solid, with 17 radiologists currently employed in the area. The cost of living index stands at 103.2, suggesting that while salaries are competitive, the cost of essentials may impact take-home purchasing power. Among various employers, private radiology group practices and hospital-employed imaging departments typically offer the highest compensation. Factors influencing salary disparities include RVU productivity, the mix of subspecializations—where interventional radiology might command a premium—and the differences between partnership opportunities versus W-2 employment. Those aiming to maximize their pay in Portsmouth should focus on building subspecialty skills, engaging in teleradiology, and potentially considering private practice for greater income potential through equity stakes and profit-sharing arrangements.
More salary data for Portsmouth, VA:
Frequently Asked Questions
How much do radiologists make in Portsmouth, VA in 2026?
Is Portsmouth, VA a good place to work as a radiologist?
Can radiologists make $100K in Portsmouth?
What is the cost-of-living adjusted radiologist salary in Portsmouth?
How much does a radiologist make per hour in Portsmouth?
Related Pages
Compare Salaries
Career Resources
Nearby Cities in Virginia
Written by Dr. Maria Chen, MD
Career Analyst
Dr. Chen has 10 years of experience in diagnostic radiology. She specializes in imaging techniques for oncology. She works at a regional medical center.
Methodology & Data Source
Salary figures on this page are 2026 projections based on the Bureau of Labor Statistics Occupational Employment and Wage Statistics (OEWS) survey, May 2026 release. The BLS reported a median annual salary of $453,333 for radiologistsin the Portsmouth metropolitan area. A 5.00% compound annual growth rate (CAGR), calculated from 6-year national BLS wage trends, was applied to project current 2026 compensation. Percentile ranges (P10–P90) represent the full salary distribution across experience levels and practice settings in this market.
Data Sources & Methodology
Salary data for Portsmouth is estimated from official BLS state-level occupational wage data (2025), adjusted for regional cost-of-living differences using BEA RPP (Regional Price Parities).
2026 figures are projected from 2025 BLS data using a compound annual growth rate (CAGR) of 5.00%, derived from historical BLS wage trends for radiologists (SOC 29-1224).
Compiled and verified by Dr. Maria Chen, MD, a licensed radiologist with 10+ years of clinical experience. · View source data at BLS.gov