Radiologist Salary in Burlington, VT: $511,369 (2026)
Quick Answer:A full-time radiologist in Burlington, VT earns a median $511,369/year (≈ $245.85/hour) in nominal terms for 2026 — projected from BLS OEWS 2025 (SOC 29-1224). Once you factor in Burlington's price level (4% above national, BEA RPP 103.5), that paycheck buys what $494,076 would nationally. Nominal pay sits 4.0% below the Vermont state average.
Based on BLS state-level estimates · View source
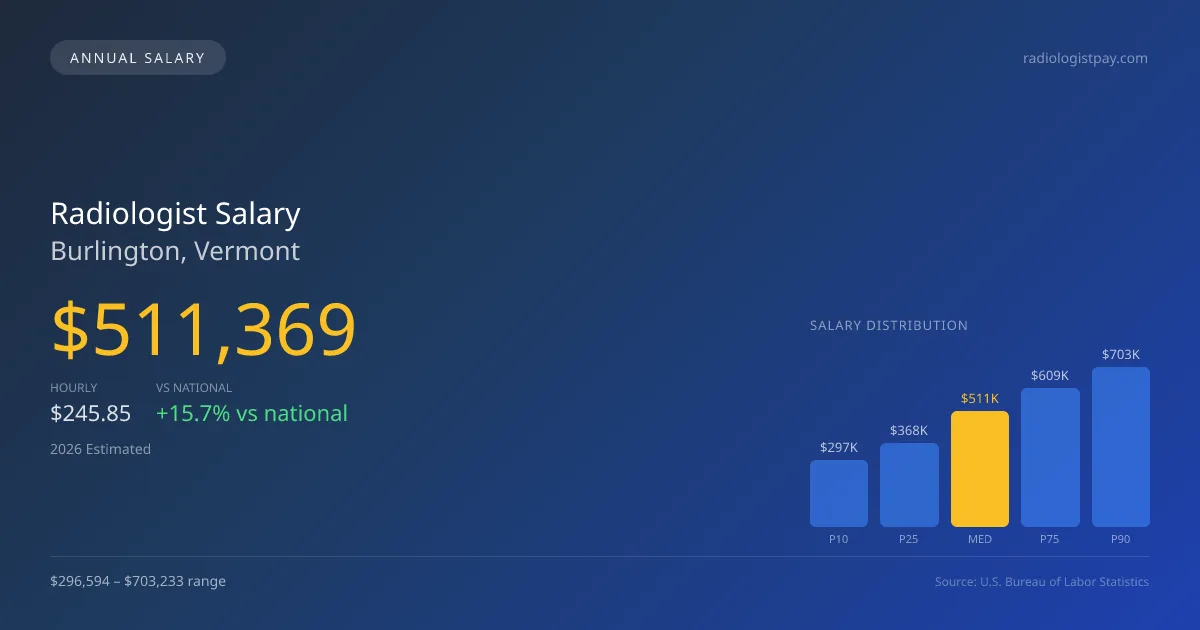
Radiologists in Burlington, Vermont can expect a favorable median annual salary of $511,369 in 2026, which stands well above the national median of $441,903. This competitive pay reflects local estimates derived from 2025 BLS data adjusted for regional living costs. Salary figures fall within a range from $296,594 at the lower tenth percentile to $703,233 at the ninetieth percentile, highlighting the significant disparity in earnings based on experience, subspecialty, and practice setting. In a city where teleradiology is growing, many professionals are able to supplement their income, which enhances their effective hourly compensation and can significantly improve overall earnings.
About the Burlington Market
Salary estimated from Vermont average ($360,000) adjusted for local cost of living.
Salary Breakdown
| Percentile | Annual | Hourly |
|---|---|---|
| Entry Level (P10) | $296,594 | $142.59 |
| Lower Range (P25) | $368,186 | $177.01 |
| Median (P50)(typical) | $511,369 | $245.85 |
| Upper Range (P75) | $609,382 | $292.97 |
| Top Earners (P90) | $703,233 | $338.09 |
Median Salary Position
15.72% above the national average
2026 Salary Percentile Distribution in Burlington
In Burlington, VT, the radiologist salary spread from the 10th to 90th percentile is $406,639 (2026 est.). At $511,369, the local median is 15.72% above the national median of $441,903.
Salary Calculator
At 40 hours/week in Burlington: You'd be above the median
How Burlington Radiologist Pay Compares
Burlington median: $511,369/year (2026)
| Compared To | Median Salary | Burlington Pays |
|---|---|---|
| Vermont Average | $532,676 | -4.00% less |
| National Average | $441,903 | +15.72% more |
Radiologists in Burlington, VT earn a median of $511,369 per year (2026 est.), which is 15.72% higher than the national median of $441,903 and 4.00% below the Vermont state average of $532,676.
Cost-of-Living Adjusted Salary
Burlington has a cost of living 3.50% above the national average.
Adjusted salary = nominal × (100 / CoL index). CoL index: 100 = national average.
Burlington, VT has a cost-of-living index of 103.5 (above the national average of 100). While the nominal salary of $511,369 is competitive, the higher cost of living reduces purchasing power to an effective $494,076 — a 3.38% reduction.
Compare Purchasing Power
Select a city to see how your salary compares after cost of living
Select a city above to compare purchasing power
2021 BLS Actual
$400,671
2025 BLS Actual
$487,018
2026 Current Est.
$511,369
2021–2027 Growth
+34.0%
Salary Trajectory for Radiologists in Burlington (2021–2027)
2021–2025: actual BLS OEWS data for this metro area. 2026+: CAGR 5.00% projection.
| Year | Annual Salary | Status |
|---|---|---|
| 2021 | $400,671 | Actual |
| 2022 | $420,704 | Actual |
| 2023 | $441,740 | Actual |
| 2024 | $357,562 | Actual |
| 2025 | $487,018 | Actual |
| 2026(current) | $511,369 | Estimated |
| 2027 | $536,937 | Projected |
Based on 5 years of BLS OEWS data for the Burlington metropolitan area, the median radiologist salary grew 21.6% from $400,671 (2021) to $487,018 (2025). At a 5.00% compound annual growth rate, salaries are projected to reach $536,937 by 2027 — a total increase of $136,266 (34.01%) from 2021.
Note: Historical values (2021–2025) are actual BLS OEWS figures for the Burlington metropolitan area, sourced from annual Occupational Employment and Wage Statistics surveys. 2026–2026 figures are current estimates, and 2027 values are projections, calculated using a 5.00% CAGR derived from 5-year BLS historical data. Actual salaries may vary based on employer, experience, certifications, and local market conditions.
Salary by Experience Level
| Experience | Estimated Salary Range |
|---|---|
| 0-2 years (New Graduate) | $296,594 – $368,186 |
| 3-5 years (Mid Career) | $368,186 – $511,369 |
| 5+ years (Experienced) | $511,369 – $609,382 |
| 10+ years (Top Earner) | $609,382 – $703,233 |
MD, DO salary ranges estimated from BLS percentile data. Individual radiologist compensation varies by employer, certifications, and specialization.
Radiologist Job Market in Burlington
With only 10 radiologists currently employed in Burlington, the local job market is relatively small yet stable. The cost of living index sits at 103.5, suggesting that while expenses are slightly above the national average, the high radiologist pay in Burlington VT mitigates the impact of these costs. Most lucrative opportunities are often found in private radiology partnerships, which can yield compensation in the higher brackets, while hospital-employed positions typically offer lower pay. Factors contributing to the variance in salaries include RVU productivity, the mix of subspecialties—interventional radiology often commands significant premiums, and daytime vs. evening call burdens. For radiologists looking to maximize their pay in Burlington, developing subspecialties such as IR or pursuing opportunities with teleradiology firms may prove beneficial.
More salary data for Burlington, VT:
Frequently Asked Questions
How much do radiologists make in Burlington, VT in 2026?
Is Burlington, VT a good place to work as a radiologist?
Can radiologists make $100K in Burlington?
What is the cost-of-living adjusted radiologist salary in Burlington?
How much does a radiologist make per hour in Burlington?
Related Pages
Compare Salaries
Career Resources
Nearby Cities in Vermont
Written by Dr. Maria Chen, MD
Career Analyst
Dr. Chen has 10 years of experience in diagnostic radiology. She specializes in imaging techniques for oncology. She works at a regional medical center.
Methodology & Data Source
Salary figures on this page are 2026 projections based on the Bureau of Labor Statistics Occupational Employment and Wage Statistics (OEWS) survey, May 2026 release. The BLS reported a median annual salary of $487,018 for radiologistsin the Burlington metropolitan area. A 5.00% compound annual growth rate (CAGR), calculated from 6-year national BLS wage trends, was applied to project current 2026 compensation. Percentile ranges (P10–P90) represent the full salary distribution across experience levels and practice settings in this market.
Data Sources & Methodology
Salary data for Burlington is estimated from official BLS state-level occupational wage data (2025), adjusted for regional cost-of-living differences using BEA RPP (Regional Price Parities).
2026 figures are projected from 2025 BLS data using a compound annual growth rate (CAGR) of 5.00%, derived from historical BLS wage trends for radiologists (SOC 29-1224).
Compiled and verified by Dr. Maria Chen, MD, a licensed radiologist with 10+ years of clinical experience. · View source data at BLS.gov