Radiologist Salary in Vermont: $503,459 (2026)
Quick Answer:Across Vermont's 9 metropolitan areas, the average median radiologist pay sits at $503,459/year heading into 2026 — a figure projected from 2025 BLS OEWS wage data for SOC 29-1224. Because Vermont sits at BEA RPP 103.5 (4% above the U.S. baseline), that statewide median translates to roughly $486,434 in nationally-comparable purchasing power. Highest-paying metros: Burlington ($487,018), Bennington ($486,305), Brattleboro ($480,809).
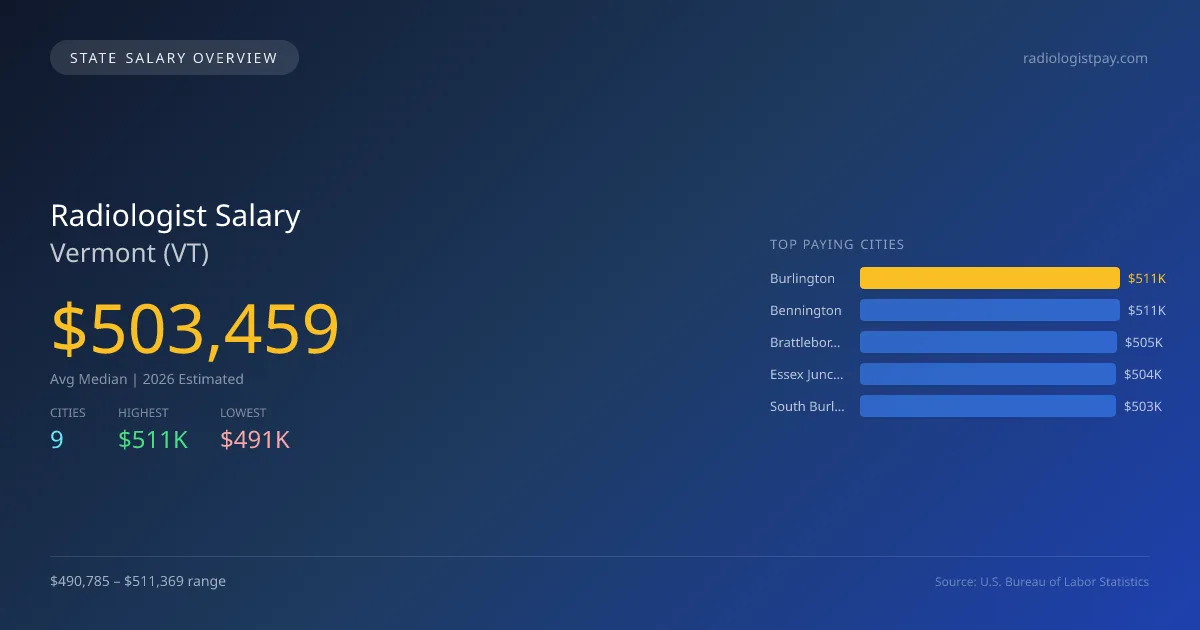
In 2026, radiologists in Vermont are projected to earn an average median salary of $503,459, which is 13.9% higher than the national median of $441,903. Burlington ranks as the highest-paying city in the state, with an expected salary of $511,369, while Montpelier has the lowest projected salary at $490,785, creating a salary gap of $20,584. This difference can be attributed to various factors, such as the cost of living, demand for radiology services in urban versus rural areas, and the presence of healthcare facilities. Vermont's state licensing requirements and scope of practice laws ensure that radiologists maintain high standards in patient care. The job market is poised for growth, with a projected annual compound growth rate of 5.00%, indicating a steady demand for radiology professionals. The total employed radiologists in the state is approximately 50, with significant salary levels also observed in Bennington at $510,620, Brattleboro at $504,849, Essex Junction at $503,768, and South Burlington at $503,447. These figures highlight the overall stability and upward trajectory of the radiology field within Vermont, making it a viable option for those exploring a career in this domain.
Vermont Radiologist Salary Range
Overall salary range in Vermont: $284,655 (lowest entry-level) to $703,233 (highest top earner)
Vermont vs National Average
Vermont radiologists earn 13.93% more than the national median (+$61,556/year difference).
Vermont Radiologist Salary Distribution (2026)
Radiologist salaries in Vermont range from $292,006 (entry-level, 10th percentile) to $674,521 (top earners, 90th percentile), with a median of $503,459. The Vermont median is $61,556 above the US national median of $441,903. The average hourly rate is $242.05/hr. Approximately 50 radiologists are employed across 9 cities.
2021 BLS Actual
$394,473
2025 BLS Actual
$479,485
2026 Current Est.
$503,459
2021–2027 Growth
+34.0%
Salary Trajectory for Radiologists in Vermont (2021–2027)
2021–2025: actual BLS OEWS data for this metro area. 2026+: CAGR 5.00% projection.
| Year | Annual Salary | Status |
|---|---|---|
| 2021 | $394,473 | Actual |
| 2022 | $414,197 | Actual |
| 2023 | $434,907 | Actual |
| 2024 | $352,031 | Actual |
| 2025 | $479,485 | Actual |
| 2026(current) | $503,459 | Estimated |
| 2027 | $528,632 | Projected |
Based on 5 years of BLS OEWS data for the Vermont metropolitan area, the median radiologist salary grew 21.6% from $394,473 (2021) to $479,485 (2025). At a 5.00% compound annual growth rate, salaries are projected to reach $528,632 by 2027 — a total increase of $134,159 (34.01%) from 2021.
Note: Historical values (2021–2025) are actual BLS OEWS figures for the Vermont metropolitan area, sourced from annual Occupational Employment and Wage Statistics surveys. 2026–2026 figures are current estimates, and 2027 values are projections, calculated using a 5.00% CAGR derived from 5-year BLS historical data. Actual salaries may vary based on employer, experience, certifications, and local market conditions.
Top 5 Highest Paying Cities in Vermont
Lowest Paying Cities in Vermont
| City | Median Salary |
|---|---|
| Montpelier | $490,785 |
| Colchester | $493,269 |
| Rutland | $493,830 |
| Barre | $503,087 |
| South Burlington | $503,447 |
Best Value Cities for Radiologists in Vermont
When adjusted for local cost of living, these Vermont cities offer the most purchasing power for radiologists.
| City | Nominal Salary | CoL Index | Adjusted Salary |
|---|---|---|---|
| Burlington | $511,369 | 103.5 | $494,076 |
| Bennington | $510,620 | 103.5 | $493,353 |
| Brattleboro | $504,849 | 103.5 | $487,777 |
| Essex Junction | $503,768 | 103.5 | $486,732 |
| South Burlington | $503,447 | 103.5 | $486,422 |
Adjusted salary = nominal salary × (100 / CoL index). CoL index: 100 = national average. Lower index = lower cost of living.
Salary by Experience Level in Vermont
| Experience Level | Estimated Annual |
|---|---|
| Entry Level (0-2 years) | $292,006 |
| Mid Career (3-7 years) | $503,459 |
| Experienced (7+ years) | $674,521 |
Estimates based on BLS percentile data averaged across Vermont metro areas. Individual pay varies by employer, certifications, and specialization.
All 9 Cities in Vermont
| # | City | Median Salary |
|---|---|---|
| 1 | Burlington | $511,369 |
| 2 | Bennington | $510,620 |
| 3 | Brattleboro | $504,849 |
| 4 | Essex Junction | $503,768 |
| 5 | South Burlington | $503,447 |
| 6 | Barre | $503,087 |
| 7 | Rutland | $493,830 |
| 8 | Colchester | $493,269 |
| 9 | Montpelier | $490,785 |
More Vermont Salary Data
Senior / Experienced
Top earner salaries for experienced radiologists.
Explore More Radiologist Salary Data
Frequently Asked Questions
How much do radiologists make in Vermont in 2026?
What is the highest paying city for radiologists in Vermont?
How does Vermont radiologist pay compare to the national average?
What is the entry-level radiologist salary in Vermont?
How many radiologists are employed in Vermont?
Which Vermont city offers the best value for radiologists?
Written by Dr. Maria Chen, MD
Career Analyst
Dr. Chen has 10 years of experience in diagnostic radiology. She specializes in imaging techniques for oncology. She works at a regional medical center.
Methodology & Data Source
Statewide salary figures on this page are 2026 projections based on the Bureau of Labor Statistics Occupational Employment and Wage Statistics (OEWS) survey, May 2026 release. A 5.00% compound annual growth rate (CAGR), derived from 6-year national BLS wage trends, was applied to each metro area's reported salary to estimate current 2026 radiologist compensation across Vermont. State averages are employment-weighted across 9 metro areas — larger metro areas with more radiologistscontribute proportionally more to the average, producing figures that better reflect typical compensation. Individual pay varies by city, employer, certifications, and experience.
Data Sources & Methodology
Source: BLS, OEWS, 2-year dataset (–). Per-city data from annual BLS metropolitan area surveys.
2026 figures are projected from 2025 BLS data using a compound annual growth rate (CAGR) of 5.00%, derived from historical BLS wage trends for radiologists (SOC 29-1224).
Compiled and verified by Dr. Maria Chen, MD, a licensed radiologist with 10+ years of clinical experience. · View source data at BLS.gov