Radiologist Salary in Forney, TX: $415,994 (2026)
Quick Answer:A full-time radiologist in Forney, TX earns a median $415,994/year (≈ $199.99/hour) in nominal terms for 2026 — projected from BLS OEWS 2025 (SOC 29-1224). Once you factor in Forney's price level (4% below national, BEA RPP 96.0), that paycheck buys what $433,327 would nationally. Nominal pay sits 1.9% below the Texas state average.
Based on BLS state-level estimates · View source
In Forney, TX, radiologists can anticipate a median annual salary of $415,994 in 2026, which reflects the area's unique subspecialty mix that includes interventional radiology (IR), general diagnostics, and breast imaging. The salary range for radiologists here spans from $241,276 at the 10th percentile to $563,875 at the 90th percentile, highlighting the potential for variation based on experience and subspecialization. These figures come from estimates derived from 2025 BLS data, adjusted for regional cost factors, providing a solid foundation for understanding the earnings landscape in Forney. With a local job market employing just six radiologists, available opportunities may be somewhat limited, but the compensation indicates that there is demand for skilled professionals in the area.
About the Forney Market
Salary estimated from Texas average ($425,000) adjusted for local cost of living.
Salary Breakdown
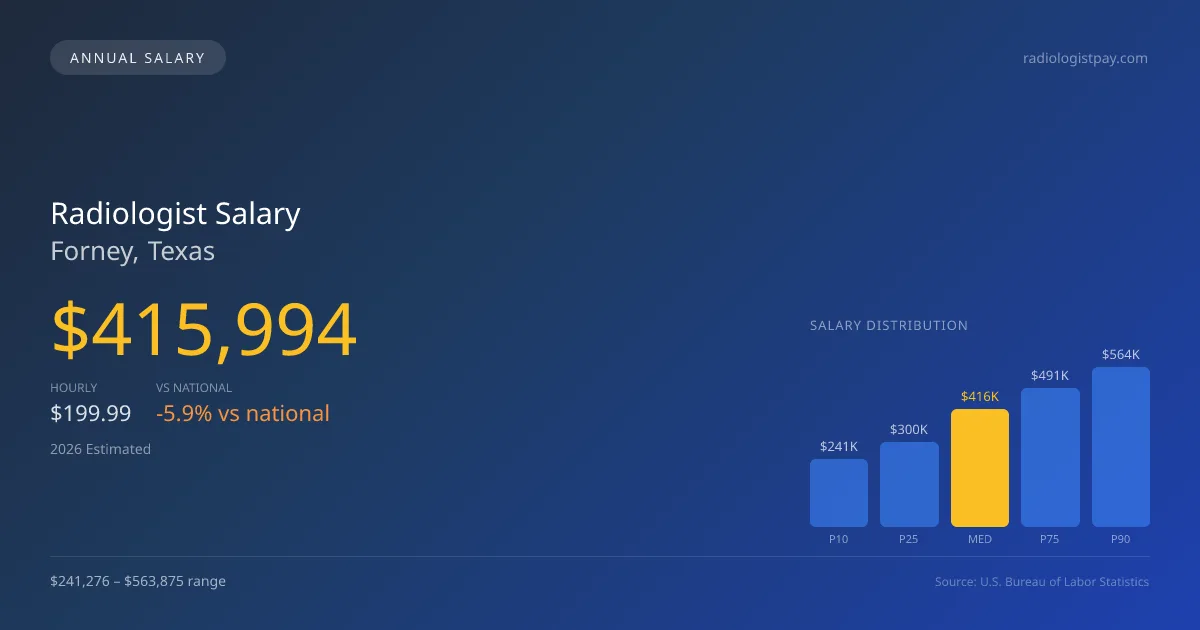
| Percentile | Annual | Hourly |
|---|---|---|
| Entry Level (P10) | $241,276 | $115.99 |
| Lower Range (P25) | $299,516 | $144.00 |
| Median (P50)(typical) | $415,994 | $199.99 |
| Upper Range (P75) | $490,732 | $235.92 |
| Top Earners (P90) | $563,875 | $271.09 |
Median Salary Position
5.86% below the national average
2026 Salary Percentile Distribution in Forney
In Forney, TX, the radiologist salary spread from the 10th to 90th percentile is $322,599 (2026 est.). At $415,994, the local median is 5.86% below the national median of $441,903.
Salary Calculator
At 40 hours/week in Forney: You'd be above the median
How Forney Radiologist Pay Compares
Forney median: $415,994/year (2026)
| Compared To | Median Salary | Forney Pays |
|---|---|---|
| Texas Average | $424,051 | -1.90% less |
| National Average | $441,903 | -5.86% less |
Radiologists in Forney, TX earn a median of $415,994 per year (2026 est.), which is 5.86% lower than the national median of $441,903 and 1.90% below the Texas state average of $424,051.
Cost-of-Living Adjusted Salary
Forney has a cost of living 4.00% below the national average, meaning your salary goes further here.
Adjusted salary = nominal × (100 / CoL index). CoL index: 100 = national average.
Forney, TX has a cost-of-living index of 96 (below the national average of 100). A radiologist earning $415,994 nominally has purchasing power equivalent to $433,327 in an average-cost city — an effective 4.17% boost.
Compare Purchasing Power
Select a city to see how your salary compares after cost of living
Select a city above to compare purchasing power
2021 BLS Actual
$325,942
2025 BLS Actual
$396,185
2026 Current Est.
$415,994
2021–2027 Growth
+34.0%
Salary Trajectory for Radiologists in Forney (2021–2027)
2021–2025: actual BLS OEWS data for this metro area. 2026+: CAGR 5.00% projection.
| Year | Annual Salary | Status |
|---|---|---|
| 2021 | $325,942 | Actual |
| 2022 | $342,239 | Actual |
| 2023 | $359,351 | Actual |
| 2024 | $400,082 | Actual |
| 2025 | $396,185 | Actual |
| 2026(current) | $415,994 | Estimated |
| 2027 | $436,794 | Projected |
Based on 5 years of BLS OEWS data for the Forney metropolitan area, the median radiologist salary grew 21.6% from $325,942 (2021) to $396,185 (2025). At a 5.00% compound annual growth rate, salaries are projected to reach $436,794 by 2027 — a total increase of $110,852 (34.01%) from 2021.
Note: Historical values (2021–2025) are actual BLS OEWS figures for the Forney metropolitan area, sourced from annual Occupational Employment and Wage Statistics surveys. 2026–2026 figures are current estimates, and 2027 values are projections, calculated using a 5.00% CAGR derived from 5-year BLS historical data. Actual salaries may vary based on employer, experience, certifications, and local market conditions.
Salary by Experience Level
| Experience | Estimated Salary Range |
|---|---|
| 0-2 years (New Graduate) | $241,276 – $299,516 |
| 3-5 years (Mid Career) | $299,516 – $415,994 |
| 5+ years (Experienced) | $415,994 – $490,732 |
| 10+ years (Top Earner) | $490,732 – $563,875 |
MD, DO salary ranges estimated from BLS percentile data. Individual radiologist compensation varies by employer, certifications, and specialization.
Radiologist Job Market in Forney
The local market for radiologist pay in Forney reflects a cost of living index of 96, which is slightly below the national average. This can enhance take-home purchasing power and suggests a favorable environment for radiologists, especially when considering potential employers such as private radiology groups and hospital-employed positions. The competition for top pay typically revolves around subspecialties; for example, interventional radiology often commands premiums of 30-50%, while factors like RVU productivity and weekend call coverage can further impact compensation. Radiologists aiming for higher earnings should consider pursuing partnerships in private practices or exploring teleradiology options, as these avenues often yield greater financial rewards compared to W-2 employment models. As the market evolves, understanding these dynamics will be essential for maximizing earnings in the Forney area.
More salary data for Forney, TX:
Frequently Asked Questions
How much do radiologists make in Forney, TX in 2026?
Is Forney, TX a good place to work as a radiologist?
Can radiologists make $100K in Forney?
What is the cost-of-living adjusted radiologist salary in Forney?
How much does a radiologist make per hour in Forney?
Related Pages
Compare Salaries
Career Resources
Nearby Cities in Texas
Written by Dr. Maria Chen, MD
Career Analyst
Dr. Chen has 10 years of experience in diagnostic radiology. She specializes in imaging techniques for oncology. She works at a regional medical center.
Methodology & Data Source
Salary figures on this page are 2026 projections based on the Bureau of Labor Statistics Occupational Employment and Wage Statistics (OEWS) survey, May 2026 release. The BLS reported a median annual salary of $396,185 for radiologistsin the Forney metropolitan area. A 5.00% compound annual growth rate (CAGR), calculated from 6-year national BLS wage trends, was applied to project current 2026 compensation. Percentile ranges (P10–P90) represent the full salary distribution across experience levels and practice settings in this market.
Data Sources & Methodology
Salary data for Forney is estimated from official BLS state-level occupational wage data (2025), adjusted for regional cost-of-living differences using BEA RPP (Regional Price Parities).
2026 figures are projected from 2025 BLS data using a compound annual growth rate (CAGR) of 5.00%, derived from historical BLS wage trends for radiologists (SOC 29-1224).
Compiled and verified by Dr. Maria Chen, MD, a licensed radiologist with 10+ years of clinical experience. · View source data at BLS.gov