Radiologist Salary in Texas: $334,575 (2026)
Quick Answer:Across Texas's 109 metropolitan areas, the average median radiologist pay sits at $334,575/year heading into 2026 — a figure projected from 2025 BLS OEWS wage data for SOC 29-1224. Because Texas sits at BEA RPP 96.0 (4% below the U.S. baseline), that statewide median translates to roughly $348,516 in nationally-comparable purchasing power. Highest-paying metros: Fort Worth ($433,503), Austin ($431,304), El Paso ($428,721).
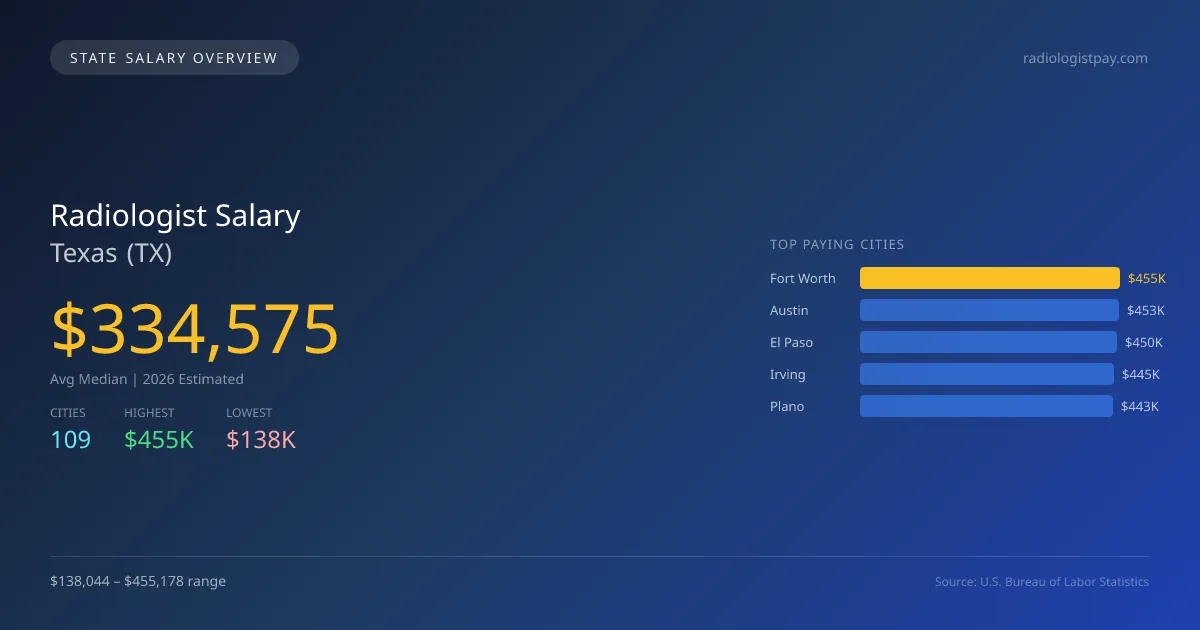
In 2026, the average median salary for radiologists in Texas is projected at $334,575, which is significantly lower than the national median of $441,903, reflecting a difference of 24.3%. The highest-paying city in Texas is Fort Worth, where radiologists can expect to earn $455,178, while Houston represents the low end of the spectrum at $138,044. This considerable salary gap may be attributed to variations in the demand for medical services, cost of living, and the presence of healthcare institutions in different regions. Texas has specific licensing requirements and scope of practice laws that can influence the job market for radiologists. The demand for radiologists is driven by the state's growing population and expanding healthcare facilities, contributing to a projected annual growth rate of 5.00% in the field. Currently, there are 3,624 radiologists employed across the state, with the top cities projected for 2026 being Fort Worth, Austin at $452,869, El Paso at $450,157, Irving at $444,627, and Plano at $443,159. Overall, the job market for radiologists in Texas shows promise, especially in metropolitan areas where healthcare demand is on the rise.
Texas Radiologist Salary Range
Overall salary range in Texas: $78,372 (lowest entry-level) to $681,562 (highest top earner)
Texas vs National Average
Texas radiologists earn 24.29% less than the national median ($-107,328/year difference).
Texas Radiologist Salary Distribution (2026)
Radiologist salaries in Texas range from $191,414 (entry-level, 10th percentile) to $566,495 (top earners, 90th percentile), with a median of $334,575. The Texas median is $107,328 below the US national median of $441,903. The average hourly rate is $160.85/hr. Approximately 3,624 radiologists are employed across 109 cities.
2021 BLS Actual
$101,930
2025 BLS Actual
$318,643
2026 Current Est.
$334,575
2021–2027 Growth
+244.7%
Salary Trajectory for Radiologists in Texas (2021–2027)
2021–2025: actual BLS OEWS data for this metro area. 2026+: CAGR 5.00% projection.
| Year | Annual Salary | Status |
|---|---|---|
| 2021 | $101,930 | Actual |
| 2022 | $275,256 | Actual |
| 2023 | $73,000 | Actual |
| 2024 | $422,731 | Actual |
| 2025 | $318,643 | Actual |
| 2026(current) | $334,575 | Estimated |
| 2027 | $351,304 | Projected |
Based on 5 years of BLS OEWS data for the Texas metropolitan area, the median radiologist salary grew 212.6% from $101,930 (2021) to $318,643 (2025). At a 5.00% compound annual growth rate, salaries are projected to reach $351,304 by 2027 — a total increase of $249,374 (244.65%) from 2021.
Note: Historical values (2021–2025) are actual BLS OEWS figures for the Texas metropolitan area, sourced from annual Occupational Employment and Wage Statistics surveys. 2026–2026 figures are current estimates, and 2027 values are projections, calculated using a 5.00% CAGR derived from 5-year BLS historical data. Actual salaries may vary based on employer, experience, certifications, and local market conditions.
Top 5 Highest Paying Cities in Texas
Lowest Paying Cities in Texas
| City | Median Salary |
|---|---|
| Houston | $138,044 |
| Dallas | $164,640 |
| Tomball | $389,060 |
| Murphy | $392,186 |
| Horizon City | $394,834 |
Best Value Cities for Radiologists in Texas
When adjusted for local cost of living, these Texas cities offer the most purchasing power for radiologists.
| City | Nominal Salary | CoL Index | Adjusted Salary |
|---|---|---|---|
| Fort Worth | $455,178 | 96 | $474,144 |
| Austin | $452,869 | 96 | $471,739 |
| El Paso | $450,157 | 96 | $468,914 |
| Irving | $444,627 | 96 | $463,153 |
| Plano | $443,159 | 96 | $461,624 |
Adjusted salary = nominal salary × (100 / CoL index). CoL index: 100 = national average. Lower index = lower cost of living.
Salary by Experience Level in Texas
| Experience Level | Estimated Annual |
|---|---|
| Entry Level (0-2 years) | $191,414 |
| Mid Career (3-7 years) | $334,575 |
| Experienced (7+ years) | $566,495 |
Estimates based on BLS percentile data averaged across Texas metro areas. Individual pay varies by employer, certifications, and specialization.
All 109 Cities in Texas
| # | City | Median Salary |
|---|---|---|
| 1 | Fort Worth | $455,178 |
| 2 | Austin | $452,869 |
| 3 | El Paso | $450,157 |
| 4 | Irving | $444,627 |
| 5 | Plano | $443,159 |
| 6 | Corpus Christi | $441,216 |
| 7 | Garland | $440,852 |
| 8 | Frisco | $439,279 |
| 9 | Amarillo | $439,139 |
| 10 | Beaumont | $438,461 |
| 11 | College Station | $437,227 |
| 12 | Arlington | $436,441 |
| 13 | Wichita Falls | $434,999 |
| 14 | Killeen | $433,286 |
| 15 | McAllen | $432,326 |
| 16 | Round Rock | $431,469 |
| 17 | Lubbock | $430,504 |
| 18 | Conroe | $430,283 |
| 19 | Laredo | $430,085 |
| 20 | San Marcos | $429,779 |
| 21 | Port Arthur | $429,611 |
| 22 | Richardson | $429,480 |
| 23 | Carrollton | $429,412 |
| 24 | Grand Prairie | $428,692 |
| 25 | Tyler | $428,076 |
| 26 | Harlingen | $427,460 |
| 27 | Waco | $426,498 |
| 28 | Galveston | $425,546 |
| 29 | DeSoto | $425,244 |
| 30 | Missouri City | $424,807 |
| 31 | San Angelo | $424,682 |
| 32 | Brownsville | $424,134 |
| 33 | Abilene | $424,031 |
| 34 | Mission | $423,732 |
| 35 | Midland | $423,414 |
| 36 | The Woodlands | $423,345 |
| 37 | Sugar Land | $423,002 |
| 38 | Allen | $422,968 |
| 39 | Pasadena | $422,865 |
| 40 | League City | $422,591 |
| 41 | Cedar Park | $422,402 |
| 42 | Longview | $422,354 |
| 43 | Georgetown | $422,253 |
| 44 | New Braunfels | $422,248 |
| 45 | Baytown | $422,085 |
| 46 | Denton | $421,836 |
| 47 | Wylie | $421,783 |
| 48 | Cleburne | $421,722 |
| 49 | Mesquite | $421,665 |
| 50 | Pharr | $421,346 |
| 51 | McKinney | $421,288 |
| 52 | Pearland | $420,432 |
| 53 | Burleson | $420,142 |
| 54 | Odessa | $419,608 |
| 55 | Pflugerville | $419,599 |
| 56 | Cedar Hill | $419,417 |
| 57 | San Antonio | $418,614 |
| 58 | Flower Mound | $418,389 |
| 59 | Edinburg | $418,169 |
| 60 | Kyle | $418,121 |
| 61 | Del Rio | $417,640 |
| 62 | Coppell | $416,653 |
| 63 | Temple | $416,541 |
| 64 | Forney | $415,994 |
| 65 | Rowlett | $415,567 |
| 66 | The Colony | $414,941 |
| 67 | Anna | $414,776 |
| 68 | Huntsville | $414,315 |
| 69 | Texarkana | $413,756 |
| 70 | Mansfield | $413,013 |
| 71 | Weatherford | $412,932 |
| 72 | Euless | $412,745 |
| 73 | Weslaco | $412,472 |
| 74 | Hurst | $412,274 |
| 75 | Victoria | $412,005 |
| 76 | Grapevine | $411,770 |
| 77 | Leander | $411,669 |
| 78 | Little Elm | $411,648 |
| 79 | Lancaster | $411,286 |
| 80 | North Richland Hills | $410,997 |
| 81 | Duncanville | $410,925 |
| 82 | Copperas Cove | $410,134 |
| 83 | Friendswood | $410,068 |
| 84 | Seguin | $408,357 |
| 85 | Rockwall | $407,797 |
| 86 | Corinth | $407,372 |
| 87 | Schertz | $407,007 |
| 88 | Corsicana | $406,669 |
| 89 | San Juan | $406,382 |
| 90 | Kingsville | $406,349 |
| 91 | Prosper | $406,250 |
| 92 | Sachse | $405,230 |
| 93 | Bastrop | $405,170 |
| 94 | Socorro | $404,472 |
| 95 | Eagle Pass | $403,715 |
| 96 | Keller | $403,122 |
| 97 | Sherman | $403,090 |
| 98 | Lufkin | $402,661 |
| 99 | Haltom City | $402,629 |
| 100 | Nacogdoches | $402,629 |
| 101 | Benbrook | $402,299 |
| 102 | University Park | $401,916 |
| 103 | Fredericksburg | $399,396 |
| 104 | Stephenville | $396,557 |
| 105 | Horizon City | $394,834 |
| 106 | Murphy | $392,186 |
| 107 | Tomball | $389,060 |
| 108 | Dallas | $164,640 |
| 109 | Houston | $138,044 |
More Texas Salary Data
Compare Cities in Texas
View all comparisons →Explore More Radiologist Salary Data
Frequently Asked Questions
How much do radiologists make in Texas in 2026?
What is the highest paying city for radiologists in Texas?
How does Texas radiologist pay compare to the national average?
What is the entry-level radiologist salary in Texas?
How many radiologists are employed in Texas?
Which Texas city offers the best value for radiologists?
Written by Dr. Maria Chen, MD
Career Analyst
Dr. Chen has 10 years of experience in diagnostic radiology. She specializes in imaging techniques for oncology. She works at a regional medical center.
Methodology & Data Source
Statewide salary figures on this page are 2026 projections based on the Bureau of Labor Statistics Occupational Employment and Wage Statistics (OEWS) survey, May 2026 release. A 5.00% compound annual growth rate (CAGR), derived from 6-year national BLS wage trends, was applied to each metro area's reported salary to estimate current 2026 radiologist compensation across Texas. State averages are employment-weighted across 109 metro areas — larger metro areas with more radiologistscontribute proportionally more to the average, producing figures that better reflect typical compensation. Individual pay varies by city, employer, certifications, and experience.
Data Sources & Methodology
Source: BLS, OEWS, 4-year dataset (–). Per-city data from annual BLS metropolitan area surveys.
2026 figures are projected from 2025 BLS data using a compound annual growth rate (CAGR) of 5.00%, derived from historical BLS wage trends for radiologists (SOC 29-1224).
Compiled and verified by Dr. Maria Chen, MD, a licensed radiologist with 10+ years of clinical experience. · View source data at BLS.gov