Radiologist Salary in Tumwater, WA: $464,583 (2026)
Quick Answer:A full-time radiologist in Tumwater, WA earns a median $464,583/year (≈ $223.36/hour) in nominal terms for 2026 — projected from BLS OEWS 2025 (SOC 29-1224). Once you factor in Tumwater's price level (7% above national, BEA RPP 107.4), that paycheck buys what $432,573 would nationally. Nominal pay sits 2.1% below the Washington state average.
Based on BLS state-level estimates · View source
In Tumwater, Washington, the projected median annual salary for a radiologist is $464,583 in 2026. This figure reflects a higher compensation level than the national median of $441,903, indicating that professionals in this area can expect competitive pay. The salary range for radiologists spans from $269,458 at the 10th percentile to $656,775 at the 90th percentile. Local estimates from BLS state-level data, alongside regional price parities, highlight that the dynamics of private partnerships versus hospital-employed radiology structures play a significant role in shaping compensation. The robust salary potential indicates a positive outlook for those entering the radiology market in Tumwater.
About the Tumwater Market
Salary estimated from Washington average ($410,000) adjusted for local cost of living.
Salary Breakdown
| Percentile | Annual | Hourly |
|---|---|---|
| Entry Level (P10) | $269,458 | $129.55 |
| Lower Range (P25) | $334,500 | $160.82 |
| Median (P50)(typical) | $464,583 | $223.36 |
| Upper Range (P75) | $537,069 | $258.21 |
| Top Earners (P90) | $656,775 | $315.76 |
Median Salary Position
5.13% above the national average
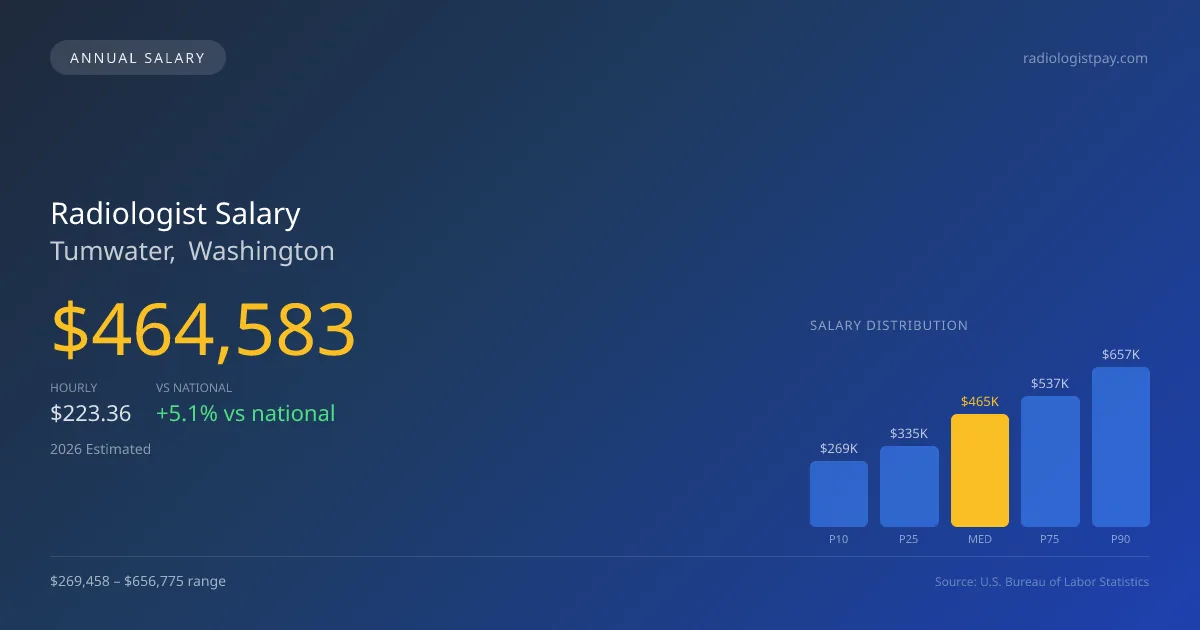
2026 Salary Percentile Distribution in Tumwater
In Tumwater, WA, the radiologist salary spread from the 10th to 90th percentile is $387,317 (2026 est.). At $464,583, the local median is 5.13% above the national median of $441,903.
Salary Calculator
At 40 hours/week in Tumwater: You'd be above the median
How Tumwater Radiologist Pay Compares
Tumwater median: $464,583/year (2026)
| Compared To | Median Salary | Tumwater Pays |
|---|---|---|
| Washington Average | $474,549 | -2.10% less |
| National Average | $441,903 | +5.13% more |
Radiologists in Tumwater, WA earn a median of $464,583 per year (2026 est.), which is 5.13% higher than the national median of $441,903 and 2.10% below the Washington state average of $474,549.
Cost-of-Living Adjusted Salary
Tumwater has a cost of living 7.40% above the national average.
Adjusted salary = nominal × (100 / CoL index). CoL index: 100 = national average.
Tumwater, WA has a cost-of-living index of 107.4 (above the national average of 100). While the nominal salary of $464,583 is competitive, the higher cost of living reduces purchasing power to an effective $432,573 — a 6.89% reduction.
Compare Purchasing Power
Select a city to see how your salary compares after cost of living
Select a city above to compare purchasing power
2021 BLS Actual
$364,013
2025 BLS Actual
$442,460
2026 Current Est.
$464,583
2021–2027 Growth
+34.0%
Salary Trajectory for Radiologists in Tumwater (2021–2027)
2021–2025: actual BLS OEWS data for this metro area. 2026+: CAGR 5.00% projection.
| Year | Annual Salary | Status |
|---|---|---|
| 2021 | $364,013 | Actual |
| 2022 | $382,214 | Actual |
| 2023 | $401,324 | Actual |
| 2024 | $431,042 | Actual |
| 2025 | $442,460 | Actual |
| 2026(current) | $464,583 | Estimated |
| 2027 | $487,812 | Projected |
Based on 5 years of BLS OEWS data for the Tumwater metropolitan area, the median radiologist salary grew 21.6% from $364,013 (2021) to $442,460 (2025). At a 5.00% compound annual growth rate, salaries are projected to reach $487,812 by 2027 — a total increase of $123,799 (34.01%) from 2021.
Note: Historical values (2021–2025) are actual BLS OEWS figures for the Tumwater metropolitan area, sourced from annual Occupational Employment and Wage Statistics surveys. 2026–2026 figures are current estimates, and 2027 values are projections, calculated using a 5.00% CAGR derived from 5-year BLS historical data. Actual salaries may vary based on employer, experience, certifications, and local market conditions.
Salary by Experience Level
| Experience | Estimated Salary Range |
|---|---|
| 0-2 years (New Graduate) | $269,458 – $334,500 |
| 3-5 years (Mid Career) | $334,500 – $464,583 |
| 5+ years (Experienced) | $464,583 – $537,069 |
| 10+ years (Top Earner) | $537,069 – $656,775 |
MD, DO salary ranges estimated from BLS percentile data. Individual radiologist compensation varies by employer, certifications, and specialization.
Radiologist Job Market in Tumwater
The job market for radiologists in Tumwater consists of a tightly-knit group of six professionals, reflecting both the community's size and the specific demand for radiological services. With a cost-of-living index of 107.4, which is above the national average, it is crucial for radiologists to consider purchasing power when evaluating their compensation. Employers in Tumwater, including private radiology group practices, hospital systems, and potentially teleradiology firms, typically exhibit varying pay scales based on factors like RVU productivity, subspecialty focus, and employment type. Those specializing in interventional radiology, for instance, may command higher salaries due to limited availability and increased demand. To maximize pay in this market, radiologists should also explore partnerships, negotiate equity stakes, and consider opportunities for additional income through night-call coverage and teleradiology options, ensuring their compensation reflects their skills and contributions to the healthcare landscape.
More salary data for Tumwater, WA:
Frequently Asked Questions
How much do radiologists make in Tumwater, WA in 2026?
Is Tumwater, WA a good place to work as a radiologist?
Can radiologists make $100K in Tumwater?
What is the cost-of-living adjusted radiologist salary in Tumwater?
How much does a radiologist make per hour in Tumwater?
Related Pages
Compare Salaries
Career Resources
Nearby Cities in Washington
Written by Dr. Maria Chen, MD
Career Analyst
Dr. Chen has 10 years of experience in diagnostic radiology. She specializes in imaging techniques for oncology. She works at a regional medical center.
Methodology & Data Source
Salary figures on this page are 2026 projections based on the Bureau of Labor Statistics Occupational Employment and Wage Statistics (OEWS) survey, May 2026 release. The BLS reported a median annual salary of $442,460 for radiologistsin the Tumwater metropolitan area. A 5.00% compound annual growth rate (CAGR), calculated from 6-year national BLS wage trends, was applied to project current 2026 compensation. Percentile ranges (P10–P90) represent the full salary distribution across experience levels and practice settings in this market.
Data Sources & Methodology
Salary data for Tumwater is estimated from official BLS state-level occupational wage data (2025), adjusted for regional cost-of-living differences using BEA RPP (Regional Price Parities).
2026 figures are projected from 2025 BLS data using a compound annual growth rate (CAGR) of 5.00%, derived from historical BLS wage trends for radiologists (SOC 29-1224).
Compiled and verified by Dr. Maria Chen, MD, a licensed radiologist with 10+ years of clinical experience. · View source data at BLS.gov