Radiologist Salary in Puyallup, WA: $454,455 (2026)
Quick Answer:A full-time radiologist in Puyallup, WA earns a median $454,455/year (≈ $218.48/hour) in nominal terms for 2026 — projected from BLS OEWS 2025 (SOC 29-1224). Once you factor in Puyallup's price level (7% above national, BEA RPP 107.4), that paycheck buys what $423,142 would nationally. Nominal pay sits 4.2% below the Washington state average.
Based on BLS state-level estimates · View source
Radiologists in Puyallup, Washington, can expect a median annual salary of $454,455 in 2026, slightly above the national average of $441,903. Salaries range from $263,584 at the lower end to $623,061 for top earners, reflecting the diverse compensation landscape in the area. The distinction between being employed by a hospital versus working in a private partnership plays a significant role in shaping these figures. In Puyallup, where the medical landscape includes both private practices and hospital systems, radiologist pay can vary significantly based on the structural dynamics of employment. With local estimates derived from BLS state-level data and adjusted for regional cost-of-living factors, radiologists have the potential to earn competitive salaries, which are bolstered by certain specialties and productivity metrics.
About the Puyallup Market
Salary estimated from Washington average ($410,000) adjusted for local cost of living.
Salary Breakdown
| Percentile | Annual | Hourly |
|---|---|---|
| Entry Level (P10) | $263,584 | $126.72 |
| Lower Range (P25) | $327,207 | $157.31 |
| Median (P50)(typical) | $454,455 | $218.48 |
| Upper Range (P75) | $550,196 | $264.52 |
| Top Earners (P90) | $623,061 | $299.54 |
Median Salary Position
2.84% above the national average
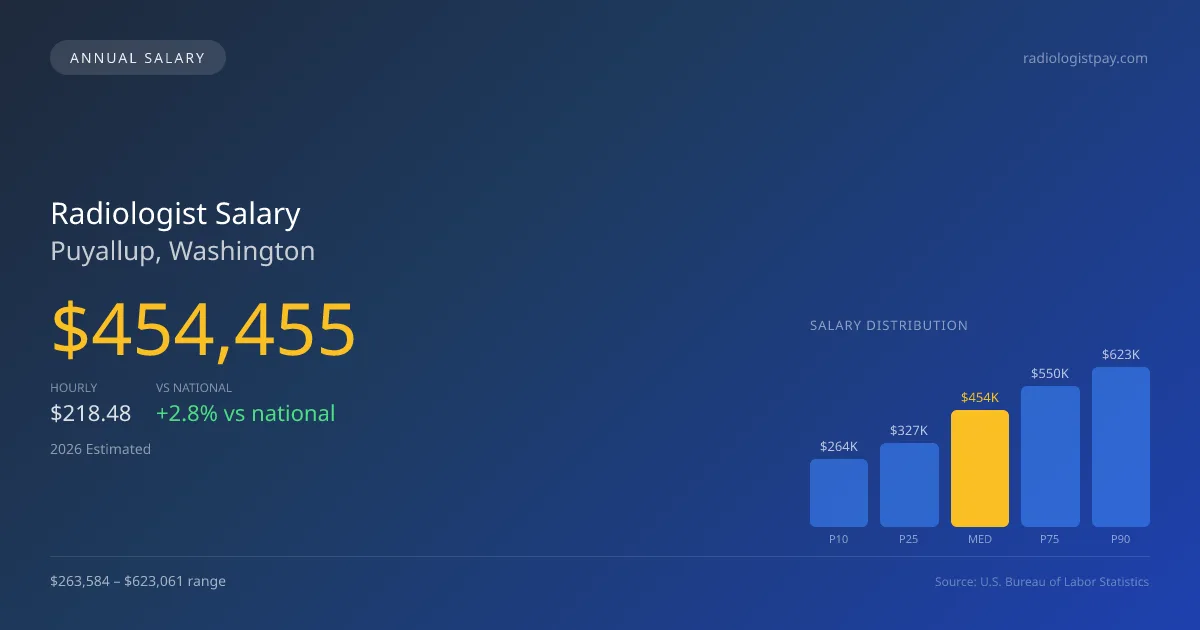
2026 Salary Percentile Distribution in Puyallup
In Puyallup, WA, the radiologist salary spread from the 10th to 90th percentile is $359,477 (2026 est.). At $454,455, the local median is 2.84% above the national median of $441,903.
Salary Calculator
At 40 hours/week in Puyallup: You'd be above the median
How Puyallup Radiologist Pay Compares
Puyallup median: $454,455/year (2026)
| Compared To | Median Salary | Puyallup Pays |
|---|---|---|
| Washington Average | $474,379 | -4.20% less |
| National Average | $441,903 | +2.84% more |
Radiologists in Puyallup, WA earn a median of $454,455 per year (2026 est.), which is 2.84% higher than the national median of $441,903 and 4.20% below the Washington state average of $474,379.
Cost-of-Living Adjusted Salary
Puyallup has a cost of living 7.40% above the national average.
Adjusted salary = nominal × (100 / CoL index). CoL index: 100 = national average.
Puyallup, WA has a cost-of-living index of 107.4 (above the national average of 100). While the nominal salary of $454,455 is competitive, the higher cost of living reduces purchasing power to an effective $423,142 — a 6.89% reduction.
Compare Purchasing Power
Select a city to see how your salary compares after cost of living
Select a city above to compare purchasing power
2021 BLS Actual
$356,077
2025 BLS Actual
$432,814
2026 Current Est.
$454,455
2021–2027 Growth
+34.0%
Salary Trajectory for Radiologists in Puyallup (2021–2027)
2021–2025: actual BLS OEWS data for this metro area. 2026+: CAGR 5.00% projection.
| Year | Annual Salary | Status |
|---|---|---|
| 2021 | $356,077 | Actual |
| 2022 | $373,881 | Actual |
| 2023 | $392,575 | Actual |
| 2024 | $421,645 | Actual |
| 2025 | $432,814 | Actual |
| 2026(current) | $454,455 | Estimated |
| 2027 | $477,177 | Projected |
Based on 5 years of BLS OEWS data for the Puyallup metropolitan area, the median radiologist salary grew 21.6% from $356,077 (2021) to $432,814 (2025). At a 5.00% compound annual growth rate, salaries are projected to reach $477,177 by 2027 — a total increase of $121,100 (34.01%) from 2021.
Note: Historical values (2021–2025) are actual BLS OEWS figures for the Puyallup metropolitan area, sourced from annual Occupational Employment and Wage Statistics surveys. 2026–2026 figures are current estimates, and 2027 values are projections, calculated using a 5.00% CAGR derived from 5-year BLS historical data. Actual salaries may vary based on employer, experience, certifications, and local market conditions.
Salary by Experience Level
| Experience | Estimated Salary Range |
|---|---|
| 0-2 years (New Graduate) | $263,584 – $327,207 |
| 3-5 years (Mid Career) | $327,207 – $454,455 |
| 5+ years (Experienced) | $454,455 – $550,196 |
| 10+ years (Top Earner) | $550,196 – $623,061 |
MD, DO salary ranges estimated from BLS percentile data. Individual radiologist compensation varies by employer, certifications, and specialization.
Radiologist Job Market in Puyallup
The job market for radiologists within Puyallup is relatively tight, with only 10 employed professionals in the area, indicating a specialized community. The cost of living index, sitting at 107.4, reflects a setting where take-home earnings can be affected by local expenses. Among local employers, private radiology groups that offer partnership opportunities tend to provide the highest pay, compared to hospital-employed positions, which typically offer more predictable W-2 compensation. The variance in pay can be attributed to factors such as RVU productivity, subspecialty focus—where interventional radiology can command higher rates—and the potential for additional income through night and weekend calls or teleradiology. To maximize earnings in the Puyallup market, radiologists may benefit from focusing on high-demand subspecialties and exploring partnerships that offer equity stakes, as well as being strategic about call coverage commitments.
More salary data for Puyallup, WA:
Frequently Asked Questions
How much do radiologists make in Puyallup, WA in 2026?
Is Puyallup, WA a good place to work as a radiologist?
Can radiologists make $100K in Puyallup?
What is the cost-of-living adjusted radiologist salary in Puyallup?
How much does a radiologist make per hour in Puyallup?
Related Pages
Compare Salaries
Career Resources
Nearby Cities in Washington
Written by Dr. Maria Chen, MD
Career Analyst
Dr. Chen has 10 years of experience in diagnostic radiology. She specializes in imaging techniques for oncology. She works at a regional medical center.
Methodology & Data Source
Salary figures on this page are 2026 projections based on the Bureau of Labor Statistics Occupational Employment and Wage Statistics (OEWS) survey, May 2026 release. The BLS reported a median annual salary of $432,814 for radiologistsin the Puyallup metropolitan area. A 5.00% compound annual growth rate (CAGR), calculated from 6-year national BLS wage trends, was applied to project current 2026 compensation. Percentile ranges (P10–P90) represent the full salary distribution across experience levels and practice settings in this market.
Data Sources & Methodology
Salary data for Puyallup is estimated from official BLS state-level occupational wage data (2025), adjusted for regional cost-of-living differences using BEA RPP (Regional Price Parities).
2026 figures are projected from 2025 BLS data using a compound annual growth rate (CAGR) of 5.00%, derived from historical BLS wage trends for radiologists (SOC 29-1224).
Compiled and verified by Dr. Maria Chen, MD, a licensed radiologist with 10+ years of clinical experience. · View source data at BLS.gov