Radiologist Salary in Kennewick, WA: $470,855 (2026)
Quick Answer:A full-time radiologist in Kennewick, WA earns a median $470,855/year (≈ $226.37/hour) in nominal terms for 2026 — projected from BLS OEWS 2025 (SOC 29-1224). Once you factor in Kennewick's price level (7% above national, BEA RPP 107.4), that paycheck buys what $438,412 would nationally. Nominal pay sits 0.8% below the Washington state average.
Based on BLS state-level estimates · View source
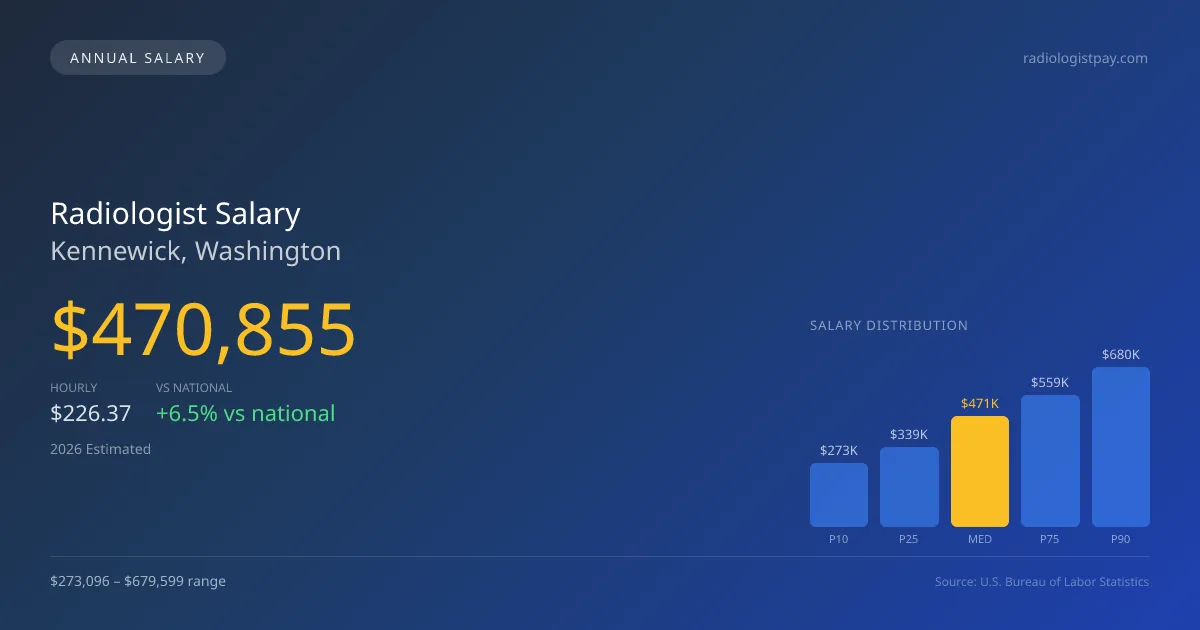
In Kennewick, Washington, radiologists can expect a median annual salary of $470,855 in 2026, which is approximately 6.55% higher than the national median for the same year. The local salary range is quite broad, varying from $273,096 at the 10th percentile to $679,599 at the 90th percentile, providing insights into the competitive nature of this field. This variance often arises from the structural divide between private partnerships and hospital W-2 employment, which affects compensation models significantly. As projected estimates derived from 2025 BLS data indicate, this market uniquely reflects both the demand for skilled radiologists and the influence of local economic factors.
About the Kennewick Market
Salary estimated from Washington average ($410,000) adjusted for local cost of living.
Salary Breakdown
| Percentile | Annual | Hourly |
|---|---|---|
| Entry Level (P10) | $273,096 | $131.29 |
| Lower Range (P25) | $339,016 | $162.99 |
| Median (P50)(typical) | $470,855 | $226.37 |
| Upper Range (P75) | $559,000 | $268.75 |
| Top Earners (P90) | $679,599 | $326.73 |
Median Salary Position
6.55% above the national average
2026 Salary Percentile Distribution in Kennewick
In Kennewick, WA, the radiologist salary spread from the 10th to 90th percentile is $406,503 (2026 est.). At $470,855, the local median is 6.55% above the national median of $441,903.
Salary Calculator
At 40 hours/week in Kennewick: You'd be in the lower-middle range
How Kennewick Radiologist Pay Compares
Kennewick median: $470,855/year (2026)
| Compared To | Median Salary | Kennewick Pays |
|---|---|---|
| Washington Average | $474,652 | -0.80% less |
| National Average | $441,903 | +6.55% more |
Radiologists in Kennewick, WA earn a median of $470,855 per year (2026 est.), which is 6.55% higher than the national median of $441,903 and 0.80% below the Washington state average of $474,652.
Cost-of-Living Adjusted Salary
Kennewick has a cost of living 7.40% above the national average.
Adjusted salary = nominal × (100 / CoL index). CoL index: 100 = national average.
Kennewick, WA has a cost-of-living index of 107.4 (above the national average of 100). While the nominal salary of $470,855 is competitive, the higher cost of living reduces purchasing power to an effective $438,412 — a 6.89% reduction.
Compare Purchasing Power
Select a city to see how your salary compares after cost of living
Select a city above to compare purchasing power
2021 BLS Actual
$368,927
2025 BLS Actual
$448,433
2026 Current Est.
$470,855
2021–2027 Growth
+34.0%
Salary Trajectory for Radiologists in Kennewick (2021–2027)
2021–2025: actual BLS OEWS data for this metro area. 2026+: CAGR 5.00% projection.
| Year | Annual Salary | Status |
|---|---|---|
| 2021 | $368,927 | Actual |
| 2022 | $387,373 | Actual |
| 2023 | $406,742 | Actual |
| 2024 | $436,861 | Actual |
| 2025 | $448,433 | Actual |
| 2026(current) | $470,855 | Estimated |
| 2027 | $494,397 | Projected |
Based on 5 years of BLS OEWS data for the Kennewick metropolitan area, the median radiologist salary grew 21.6% from $368,927 (2021) to $448,433 (2025). At a 5.00% compound annual growth rate, salaries are projected to reach $494,397 by 2027 — a total increase of $125,470 (34.01%) from 2021.
Note: Historical values (2021–2025) are actual BLS OEWS figures for the Kennewick metropolitan area, sourced from annual Occupational Employment and Wage Statistics surveys. 2026–2026 figures are current estimates, and 2027 values are projections, calculated using a 5.00% CAGR derived from 5-year BLS historical data. Actual salaries may vary based on employer, experience, certifications, and local market conditions.
Salary by Experience Level
| Experience | Estimated Salary Range |
|---|---|
| 0-2 years (New Graduate) | $273,096 – $339,016 |
| 3-5 years (Mid Career) | $339,016 – $470,855 |
| 5+ years (Experienced) | $470,855 – $559,000 |
| 10+ years (Top Earner) | $559,000 – $679,599 |
MD, DO salary ranges estimated from BLS percentile data. Individual radiologist compensation varies by employer, certifications, and specialization.
Radiologist Job Market in Kennewick
Currently, there are 19 radiologists employed in Kennewick, WA, which underscores a favorable job market for this specialty. The local cost of living index is 107.4, slightly above the national average, suggesting that while salaries are competitive, the purchasing power may be moderately impacted. Among various employers, private radiology group practices tend to offer the highest compensation, particularly for partnership tracks that can leverage equity stakes and RVU productivity. In contrast, hospital-employed radiologists and those in teleradiology may see different pay structures influenced by their job responsibilities and subspecialization. Radiologists with interventional radiology (IR) expertise often command higher salaries, reflecting the specialty's demand. To maximize pay in Kennewick, it is advisable for radiologists to consider partnerships, look into subspecialty training, and negotiate for teleradiology coverage options, all key strategies for increasing earning potential in this evolving market.
More salary data for Kennewick, WA:
Frequently Asked Questions
How much do radiologists make in Kennewick, WA in 2026?
Is Kennewick, WA a good place to work as a radiologist?
Can radiologists make $100K in Kennewick?
What is the cost-of-living adjusted radiologist salary in Kennewick?
How much does a radiologist make per hour in Kennewick?
Related Pages
Compare Salaries
Career Resources
Nearby Cities in Washington
Written by Dr. Maria Chen, MD
Career Analyst
Dr. Chen has 10 years of experience in diagnostic radiology. She specializes in imaging techniques for oncology. She works at a regional medical center.
Methodology & Data Source
Salary figures on this page are 2026 projections based on the Bureau of Labor Statistics Occupational Employment and Wage Statistics (OEWS) survey, May 2026 release. The BLS reported a median annual salary of $448,433 for radiologistsin the Kennewick metropolitan area. A 5.00% compound annual growth rate (CAGR), calculated from 6-year national BLS wage trends, was applied to project current 2026 compensation. Percentile ranges (P10–P90) represent the full salary distribution across experience levels and practice settings in this market.
Data Sources & Methodology
Salary data for Kennewick is estimated from official BLS state-level occupational wage data (2025), adjusted for regional cost-of-living differences using BEA RPP (Regional Price Parities).
2026 figures are projected from 2025 BLS data using a compound annual growth rate (CAGR) of 5.00%, derived from historical BLS wage trends for radiologists (SOC 29-1224).
Compiled and verified by Dr. Maria Chen, MD, a licensed radiologist with 10+ years of clinical experience. · View source data at BLS.gov