Radiologist Salary in Bellingham, WA: $474,200 (2026)
Quick Answer:A full-time radiologist in Bellingham, WA earns a median $474,200/year (≈ $227.98/hour) in nominal terms for 2026 — projected from BLS OEWS 2025 (SOC 29-1224). Once you factor in Bellingham's price level (7% above national, BEA RPP 107.4), that paycheck buys what $441,527 would nationally. Nominal pay sits 0.1% below the Washington state average.
Based on BLS state-level estimates · View source
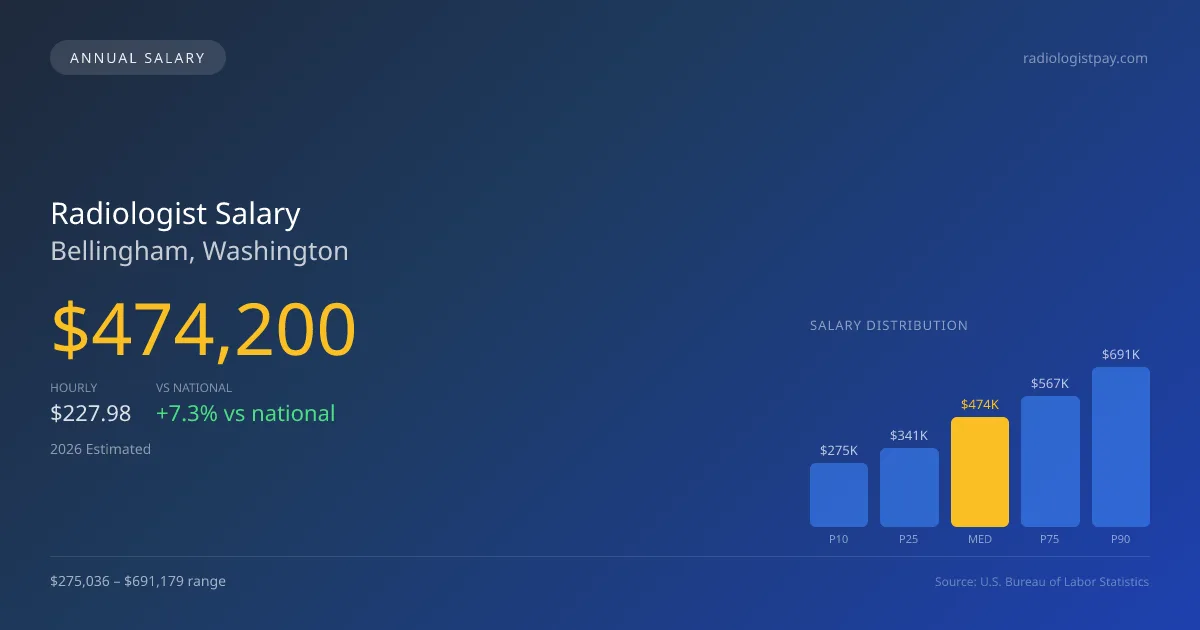
For 2026, the estimated median annual salary for radiologists in Bellingham, Washington, is $474,200, which reflects a robust position in the local market. This figure comes alongside a notable salary range of $275,036 at the 10th percentile to$691,179 at the 90th percentile, demonstrating a wide variance in compensation that is largely influenced by employment structure. Factors such as whether a radiologist is in a private partnership or a hospital W-2 position significantly shape their earnings potential. The numbers are derived from 2025 BLS data, projected to 2026, and adjusted for local economic conditions. With these dynamics in play, the job market for radiologists in Bellingham appears competitive, particularly as private equity continues to reshape radiological practices.
About the Bellingham Market
Salary estimated from Washington average ($410,000) adjusted for local cost of living.
Salary Breakdown
| Percentile | Annual | Hourly |
|---|---|---|
| Entry Level (P10) | $275,036 | $132.23 |
| Lower Range (P25) | $341,424 | $164.15 |
| Median (P50)(typical) | $474,200 | $227.98 |
| Upper Range (P75) | $567,023 | $272.61 |
| Top Earners (P90) | $691,179 | $332.29 |
Median Salary Position
7.31% above the national average
2026 Salary Percentile Distribution in Bellingham
In Bellingham, WA, the radiologist salary spread from the 10th to 90th percentile is $416,143 (2026 est.). At $474,200, the local median is 7.31% above the national median of $441,903.
Salary Calculator
At 40 hours/week in Bellingham: You'd be in the lower-middle range
How Bellingham Radiologist Pay Compares
Bellingham median: $474,200/year (2026)
| Compared To | Median Salary | Bellingham Pays |
|---|---|---|
| Washington Average | $474,675 | -0.10% less |
| National Average | $441,903 | +7.31% more |
Radiologists in Bellingham, WA earn a median of $474,200 per year (2026 est.), which is 7.31% higher than the national median of $441,903 and 0.10% below the Washington state average of $474,675.
Cost-of-Living Adjusted Salary
Bellingham has a cost of living 7.40% above the national average.
Adjusted salary = nominal × (100 / CoL index). CoL index: 100 = national average.
Bellingham, WA has a cost-of-living index of 107.4 (above the national average of 100). While the nominal salary of $474,200 is competitive, the higher cost of living reduces purchasing power to an effective $441,527 — a 6.89% reduction.
Compare Purchasing Power
Select a city to see how your salary compares after cost of living
Select a city above to compare purchasing power
2021 BLS Actual
$371,548
2025 BLS Actual
$451,619
2026 Current Est.
$474,200
2021–2027 Growth
+34.0%
Salary Trajectory for Radiologists in Bellingham (2021–2027)
2021–2025: actual BLS OEWS data for this metro area. 2026+: CAGR 5.00% projection.
| Year | Annual Salary | Status |
|---|---|---|
| 2021 | $371,548 | Actual |
| 2022 | $390,125 | Actual |
| 2023 | $409,632 | Actual |
| 2024 | $439,965 | Actual |
| 2025 | $451,619 | Actual |
| 2026(current) | $474,200 | Estimated |
| 2027 | $497,910 | Projected |
Based on 5 years of BLS OEWS data for the Bellingham metropolitan area, the median radiologist salary grew 21.6% from $371,548 (2021) to $451,619 (2025). At a 5.00% compound annual growth rate, salaries are projected to reach $497,910 by 2027 — a total increase of $126,362 (34.01%) from 2021.
Note: Historical values (2021–2025) are actual BLS OEWS figures for the Bellingham metropolitan area, sourced from annual Occupational Employment and Wage Statistics surveys. 2026–2026 figures are current estimates, and 2027 values are projections, calculated using a 5.00% CAGR derived from 5-year BLS historical data. Actual salaries may vary based on employer, experience, certifications, and local market conditions.
Salary by Experience Level
| Experience | Estimated Salary Range |
|---|---|
| 0-2 years (New Graduate) | $275,036 – $341,424 |
| 3-5 years (Mid Career) | $341,424 – $474,200 |
| 5+ years (Experienced) | $474,200 – $567,023 |
| 10+ years (Top Earner) | $567,023 – $691,179 |
MD, DO salary ranges estimated from BLS percentile data. Individual radiologist compensation varies by employer, certifications, and specialization.
Radiologist Job Market in Bellingham
Despite the relatively small size of the market, with only 13 radiologists currently employed in Bellingham, opportunities remain lucrative, especially for those who strategically align with high-paying employers. The local cost of living index is 107.4, indicating that while salaries are strong, the purchasing power is somewhat moderated compared to the national average. Within the market, private radiology group practices typically offer the highest compensation, especially for those who can leverage equity stakes or take on additional responsibilities such as night coverage through teleradiology. The disparity in earnings—driven by RVU productivity, subspecialties like interventional radiology, and the distinctions between partnership and W-2 employment—highlights the importance of negotiating favorable terms and exploring opportunities that enhance pay, thereby allowing newly practicing radiologists to maximize their earning potential in Bellingham, WA.
More salary data for Bellingham, WA:
Frequently Asked Questions
How much do radiologists make in Bellingham, WA in 2026?
Is Bellingham, WA a good place to work as a radiologist?
Can radiologists make $100K in Bellingham?
What is the cost-of-living adjusted radiologist salary in Bellingham?
How much does a radiologist make per hour in Bellingham?
Related Pages
Compare Salaries
Career Resources
Nearby Cities in Washington
Written by Dr. Maria Chen, MD
Career Analyst
Dr. Chen has 10 years of experience in diagnostic radiology. She specializes in imaging techniques for oncology. She works at a regional medical center.
Methodology & Data Source
Salary figures on this page are 2026 projections based on the Bureau of Labor Statistics Occupational Employment and Wage Statistics (OEWS) survey, May 2026 release. The BLS reported a median annual salary of $451,619 for radiologistsin the Bellingham metropolitan area. A 5.00% compound annual growth rate (CAGR), calculated from 6-year national BLS wage trends, was applied to project current 2026 compensation. Percentile ranges (P10–P90) represent the full salary distribution across experience levels and practice settings in this market.
Data Sources & Methodology
Salary data for Bellingham is estimated from official BLS state-level occupational wage data (2025), adjusted for regional cost-of-living differences using BEA RPP (Regional Price Parities).
2026 figures are projected from 2025 BLS data using a compound annual growth rate (CAGR) of 5.00%, derived from historical BLS wage trends for radiologists (SOC 29-1224).
Compiled and verified by Dr. Maria Chen, MD, a licensed radiologist with 10+ years of clinical experience. · View source data at BLS.gov