Radiologist Salary in St. George, UT: $423,558 (2026)
Quick Answer:A full-time radiologist in St. George, UT earns a median $423,558/year (≈ $203.64/hour) in nominal terms for 2026 — projected from BLS OEWS 2025 (SOC 29-1224). Once you factor in St. George's price level (2% below national, BEA RPP 98.1), that paycheck buys what $431,761 would nationally. Nominal pay sits 2.3% below the Utah state average.
Based on BLS state-level estimates · View source
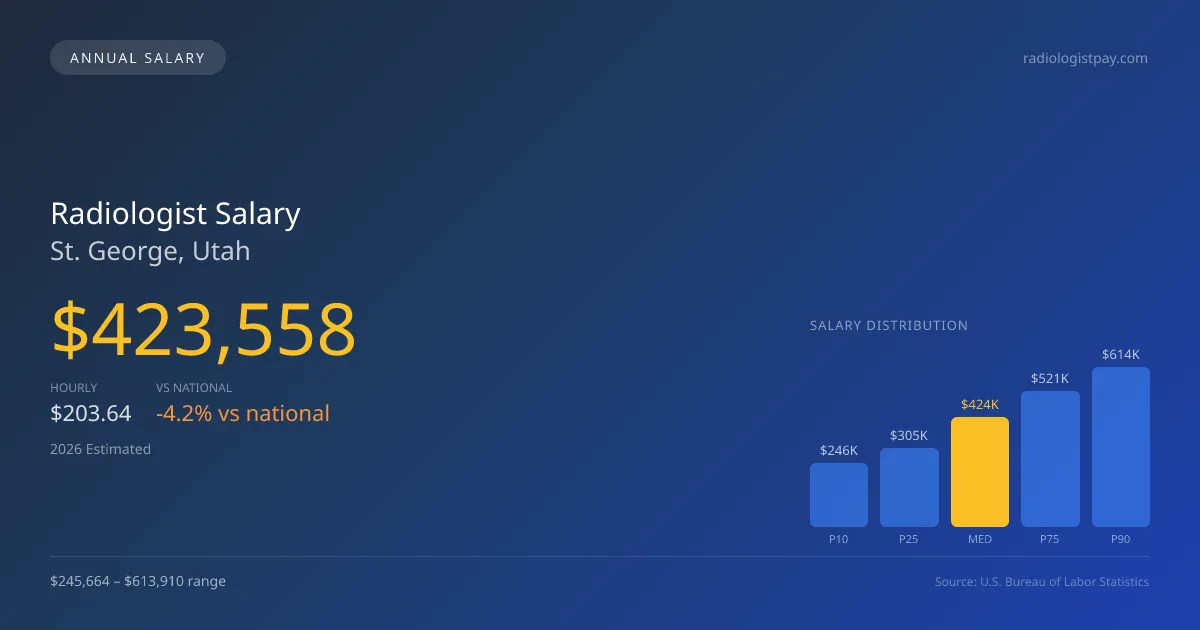
In St. George, Utah, radiologists can expect a median annual salary of $423,558 in 2026. The salary range spans from $245,664 at the P10 level to $613,910 at the P90 level, indicating a robust market for radiology professionals despite a slightly lower figure compared to the national median of $441,903. These estimates are derived from 2025 BLS data and adjusted for regional cost dynamics, reflecting local market conditions. Given the prevalence of teleradiology, many radiologists in St. George supplement their incomes, which notably influences their effective hourly compensation and aligns with the evolving digital landscape of healthcare.
About the St. George Market
Salary estimated from Utah average ($365,000) adjusted for local cost of living.
Salary Breakdown
| Percentile | Annual | Hourly |
|---|---|---|
| Entry Level (P10) | $245,664 | $118.10 |
| Lower Range (P25) | $304,962 | $146.61 |
| Median (P50)(typical) | $423,558 | $203.64 |
| Upper Range (P75) | $520,538 | $250.26 |
| Top Earners (P90) | $613,910 | $295.14 |
Median Salary Position
4.15% below the national average
2026 Salary Percentile Distribution in St. George
In St. George, UT, the radiologist salary spread from the 10th to 90th percentile is $368,246 (2026 est.). At $423,558, the local median is 4.15% below the national median of $441,903.
Salary Calculator
At 40 hours/week in St. George: You'd be in the lower-middle range
How St. George Radiologist Pay Compares
St. George median: $423,558/year (2026)
| Compared To | Median Salary | St. George Pays |
|---|---|---|
| Utah Average | $433,530 | -2.30% less |
| National Average | $441,903 | -4.15% less |
Radiologists in St. George, UT earn a median of $423,558 per year (2026 est.), which is 4.15% lower than the national median of $441,903 and 2.30% below the Utah state average of $433,530.
Cost-of-Living Adjusted Salary
St. George has a cost of living 1.90% below the national average, meaning your salary goes further here.
Adjusted salary = nominal × (100 / CoL index). CoL index: 100 = national average.
St. George, UT has a cost-of-living index of 98.1 (below the national average of 100). A radiologist earning $423,558 nominally has purchasing power equivalent to $431,761 in an average-cost city — an effective 1.94% boost.
Compare Purchasing Power
Select a city to see how your salary compares after cost of living
Select a city above to compare purchasing power
2021 BLS Actual
$331,869
2025 BLS Actual
$403,389
2026 Current Est.
$423,558
2021–2027 Growth
+34.0%
Salary Trajectory for Radiologists in St. George (2021–2027)
2021–2025: actual BLS OEWS data for this metro area. 2026+: CAGR 5.00% projection.
| Year | Annual Salary | Status |
|---|---|---|
| 2021 | $331,869 | Actual |
| 2022 | $348,463 | Actual |
| 2023 | $365,886 | Actual |
| 2024 | $349,848 | Actual |
| 2025 | $403,389 | Actual |
| 2026(current) | $423,558 | Estimated |
| 2027 | $444,736 | Projected |
Based on 5 years of BLS OEWS data for the St. George metropolitan area, the median radiologist salary grew 21.6% from $331,869 (2021) to $403,389 (2025). At a 5.00% compound annual growth rate, salaries are projected to reach $444,736 by 2027 — a total increase of $112,867 (34.01%) from 2021.
Note: Historical values (2021–2025) are actual BLS OEWS figures for the St. George metropolitan area, sourced from annual Occupational Employment and Wage Statistics surveys. 2026–2026 figures are current estimates, and 2027 values are projections, calculated using a 5.00% CAGR derived from 5-year BLS historical data. Actual salaries may vary based on employer, experience, certifications, and local market conditions.
Salary by Experience Level
| Experience | Estimated Salary Range |
|---|---|
| 0-2 years (New Graduate) | $245,664 – $304,962 |
| 3-5 years (Mid Career) | $304,962 – $423,558 |
| 5+ years (Experienced) | $423,558 – $520,538 |
| 10+ years (Top Earner) | $520,538 – $613,910 |
MD, DO salary ranges estimated from BLS percentile data. Individual radiologist compensation varies by employer, certifications, and specialization.
Radiologist Job Market in St. George
With 14 radiologists currently practicing in St. George, the job market showcases a competitive environment yet remains manageable in size. The area's cost-of-living index stands at 98.1, which offers favorable take-home purchasing power compared to higher-cost regions. Hospital-employment opportunities tend to pay less than private group practices, where income potential often exceeds $500,000, particularly for radiologists taking on partnership roles. Variations in pay arise from several factors such as RVU productivity, subspecialty mix—interventional radiologists often commanding a 30-50% premium—and the nuances of partnership equity versus W-2 employment. For those seeking to maximize their radiologist pay in St. George, strategies may involve pursuing subspecialty training, negotiating substantial RVU targets, and exploring teleradiology roles that enhance overall earnings.
More salary data for St. George, UT:
Frequently Asked Questions
How much do radiologists make in St. George, UT in 2026?
Is St. George, UT a good place to work as a radiologist?
Can radiologists make $100K in St. George?
What is the cost-of-living adjusted radiologist salary in St. George?
How much does a radiologist make per hour in St. George?
Related Pages
Compare Salaries
Career Resources
Written by Dr. Maria Chen, MD
Career Analyst
Dr. Chen has 10 years of experience in diagnostic radiology. She specializes in imaging techniques for oncology. She works at a regional medical center.
Methodology & Data Source
Salary figures on this page are 2026 projections based on the Bureau of Labor Statistics Occupational Employment and Wage Statistics (OEWS) survey, May 2026 release. The BLS reported a median annual salary of $403,389 for radiologistsin the St. George metropolitan area. A 5.00% compound annual growth rate (CAGR), calculated from 6-year national BLS wage trends, was applied to project current 2026 compensation. Percentile ranges (P10–P90) represent the full salary distribution across experience levels and practice settings in this market.
Data Sources & Methodology
Salary data for St. George is estimated from official BLS state-level occupational wage data (2025), adjusted for regional cost-of-living differences using BEA RPP (Regional Price Parities).
2026 figures are projected from 2025 BLS data using a compound annual growth rate (CAGR) of 5.00%, derived from historical BLS wage trends for radiologists (SOC 29-1224).
Compiled and verified by Dr. Maria Chen, MD, a licensed radiologist with 10+ years of clinical experience. · View source data at BLS.gov