Radiologist Salary in Cranston, RI: $434,412 (2026)
Quick Answer:A full-time radiologist in Cranston, RI earns a median $434,412/year (≈ $208.86/hour) in nominal terms for 2026 — projected from BLS OEWS 2025 (SOC 29-1224). Once you factor in Cranston's price level (1% above national, BEA RPP 100.5), that paycheck buys what $432,251 would nationally. Nominal pay sits 2.2% below the Rhode Island state average.
Based on BLS state-level estimates · View source
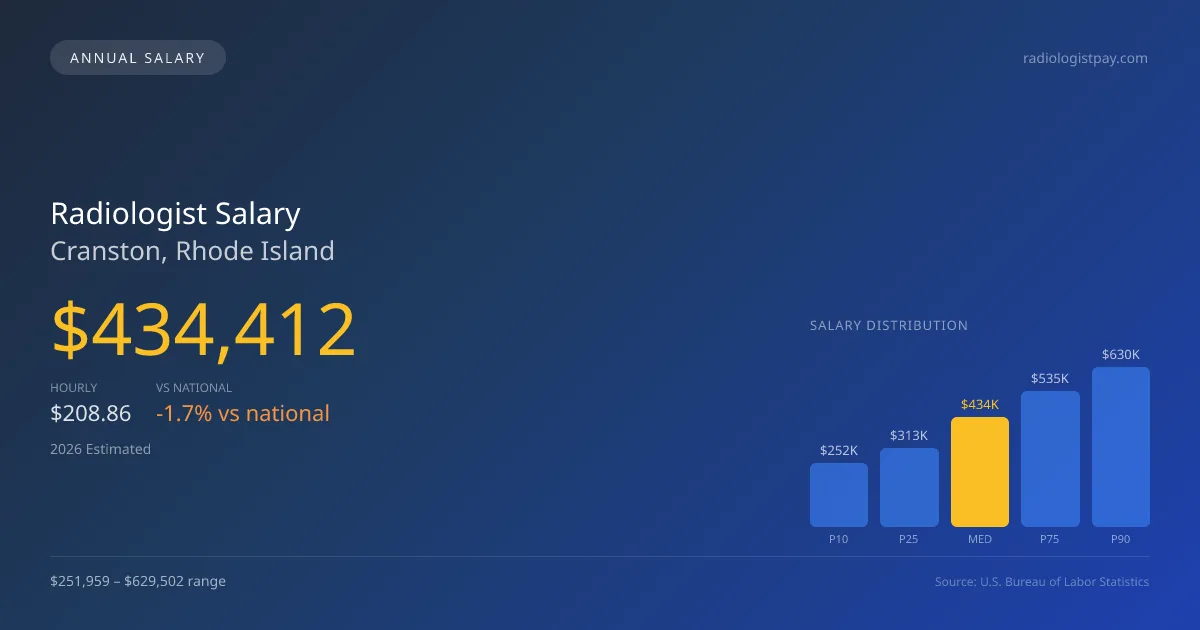
In 2026, the expected median radiologist salary in Cranston, RI, is projected at $434,412, slightly below the national median of $441,903. Radiologists in this area can anticipate a salary range spanning from $251,959 at the lower 10th percentile to as high as $629,502 at the 90th percentile. These figures, derived from 2025 BLS data and adjusted for the local cost of living, showcase how the local job market influences effective compensation. The presence of teleradiology opportunities allows local radiologists to enhance their earnings, enabling a more favorable comparison to their counterparts nationwide and providing additional flexibility in their work-life balance.
About the Cranston Market
Salary estimated from Rhode Island average ($380,000) adjusted for local cost of living.
Salary Breakdown
| Percentile | Annual | Hourly |
|---|---|---|
| Entry Level (P10) | $251,959 | $121.14 |
| Lower Range (P25) | $312,777 | $150.37 |
| Median (P50)(typical) | $434,412 | $208.86 |
| Upper Range (P75) | $535,128 | $257.27 |
| Top Earners (P90) | $629,502 | $302.64 |
Median Salary Position
1.7% below the national average
2026 Salary Percentile Distribution in Cranston
In Cranston, RI, the radiologist salary spread from the 10th to 90th percentile is $377,543 (2026 est.). At $434,412, the local median is 1.7% below the national median of $441,903.
Salary Calculator
At 40 hours/week in Cranston: You'd be in the lower-middle range
How Cranston Radiologist Pay Compares
Cranston median: $434,412/year (2026)
| Compared To | Median Salary | Cranston Pays |
|---|---|---|
| Rhode Island Average | $444,184 | -2.20% less |
| National Average | $441,903 | -1.70% less |
Radiologists in Cranston, RI earn a median of $434,412 per year (2026 est.), which is 1.70% lower than the national median of $441,903 and 2.20% below the Rhode Island state average of $444,184.
Cost-of-Living Adjusted Salary
Cranston has a cost of living 0.50% above the national average.
Adjusted salary = nominal × (100 / CoL index). CoL index: 100 = national average.
Cranston, RI has a cost-of-living index of 100.5 (above the national average of 100). While the nominal salary of $434,412 is competitive, the higher cost of living reduces purchasing power to an effective $432,251 — a 0.5% reduction.
Compare Purchasing Power
Select a city to see how your salary compares after cost of living
Select a city above to compare purchasing power
2021 BLS Actual
$340,373
2025 BLS Actual
$413,726
2026 Current Est.
$434,412
2021–2027 Growth
+34.0%
Salary Trajectory for Radiologists in Cranston (2021–2027)
2021–2025: actual BLS OEWS data for this metro area. 2026+: CAGR 5.00% projection.
| Year | Annual Salary | Status |
|---|---|---|
| 2021 | $340,373 | Actual |
| 2022 | $357,392 | Actual |
| 2023 | $375,262 | Actual |
| 2024 | $373,559 | Actual |
| 2025 | $413,726 | Actual |
| 2026(current) | $434,412 | Estimated |
| 2027 | $456,133 | Projected |
Based on 5 years of BLS OEWS data for the Cranston metropolitan area, the median radiologist salary grew 21.6% from $340,373 (2021) to $413,726 (2025). At a 5.00% compound annual growth rate, salaries are projected to reach $456,133 by 2027 — a total increase of $115,760 (34.01%) from 2021.
Note: Historical values (2021–2025) are actual BLS OEWS figures for the Cranston metropolitan area, sourced from annual Occupational Employment and Wage Statistics surveys. 2026–2026 figures are current estimates, and 2027 values are projections, calculated using a 5.00% CAGR derived from 5-year BLS historical data. Actual salaries may vary based on employer, experience, certifications, and local market conditions.
Salary by Experience Level
| Experience | Estimated Salary Range |
|---|---|
| 0-2 years (New Graduate) | $251,959 – $312,777 |
| 3-5 years (Mid Career) | $312,777 – $434,412 |
| 5+ years (Experienced) | $434,412 – $535,128 |
| 10+ years (Top Earner) | $535,128 – $629,502 |
MD, DO salary ranges estimated from BLS percentile data. Individual radiologist compensation varies by employer, certifications, and specialization.
Radiologist Job Market in Cranston
Cranston’s healthcare market employs about 12 radiologists, contributing to a steady job landscape for the profession. With a cost-of-living index of 100.5, the economic realities imply that while cervical and interventional radiologists can command higher salaries—often benefiting from RVU productivity models, subspecialization premiums, and involvement in lucrative night-shift or weekend coverage—overall compensation must be weighed against living expenses. Employers that tend to offer better pay in Cranston include private radiology practices and hospital-employed positions; however, factors such as partnership equity, teleradiology engagements, and the choice between a W-2 job or private practice heavily influence salary dynamics. To maximize pay in this local market, aspiring radiologists should consider strategic engagement in partnerships and diversifying income through teleradiology or subspecialties, particularly in interventional radiology, where high premiums may prevail.
More salary data for Cranston, RI:
Frequently Asked Questions
How much do radiologists make in Cranston, RI in 2026?
Is Cranston, RI a good place to work as a radiologist?
Can radiologists make $100K in Cranston?
What is the cost-of-living adjusted radiologist salary in Cranston?
How much does a radiologist make per hour in Cranston?
Related Pages
Compare Salaries
Career Resources
Nearby Cities in Rhode Island
Written by Dr. Maria Chen, MD
Career Analyst
Dr. Chen has 10 years of experience in diagnostic radiology. She specializes in imaging techniques for oncology. She works at a regional medical center.
Methodology & Data Source
Salary figures on this page are 2026 projections based on the Bureau of Labor Statistics Occupational Employment and Wage Statistics (OEWS) survey, May 2026 release. The BLS reported a median annual salary of $413,726 for radiologistsin the Cranston metropolitan area. A 5.00% compound annual growth rate (CAGR), calculated from 6-year national BLS wage trends, was applied to project current 2026 compensation. Percentile ranges (P10–P90) represent the full salary distribution across experience levels and practice settings in this market.
Data Sources & Methodology
Salary data for Cranston is estimated from official BLS state-level occupational wage data (2025), adjusted for regional cost-of-living differences using BEA RPP (Regional Price Parities).
2026 figures are projected from 2025 BLS data using a compound annual growth rate (CAGR) of 5.00%, derived from historical BLS wage trends for radiologists (SOC 29-1224).
Compiled and verified by Dr. Maria Chen, MD, a licensed radiologist with 10+ years of clinical experience. · View source data at BLS.gov