Radiologist Salary in Redmond, OR: $542,393 (2026)
Quick Answer:A full-time radiologist in Redmond, OR earns a median $542,393/year (≈ $260.77/hour) in nominal terms for 2026 — projected from BLS OEWS 2025 (SOC 29-1224). Once you factor in Redmond's price level (3% above national, BEA RPP 102.6), that paycheck buys what $528,648 would nationally. Nominal pay sits 2.8% below the Oregon state average.
Based on BLS state-level estimates · View source
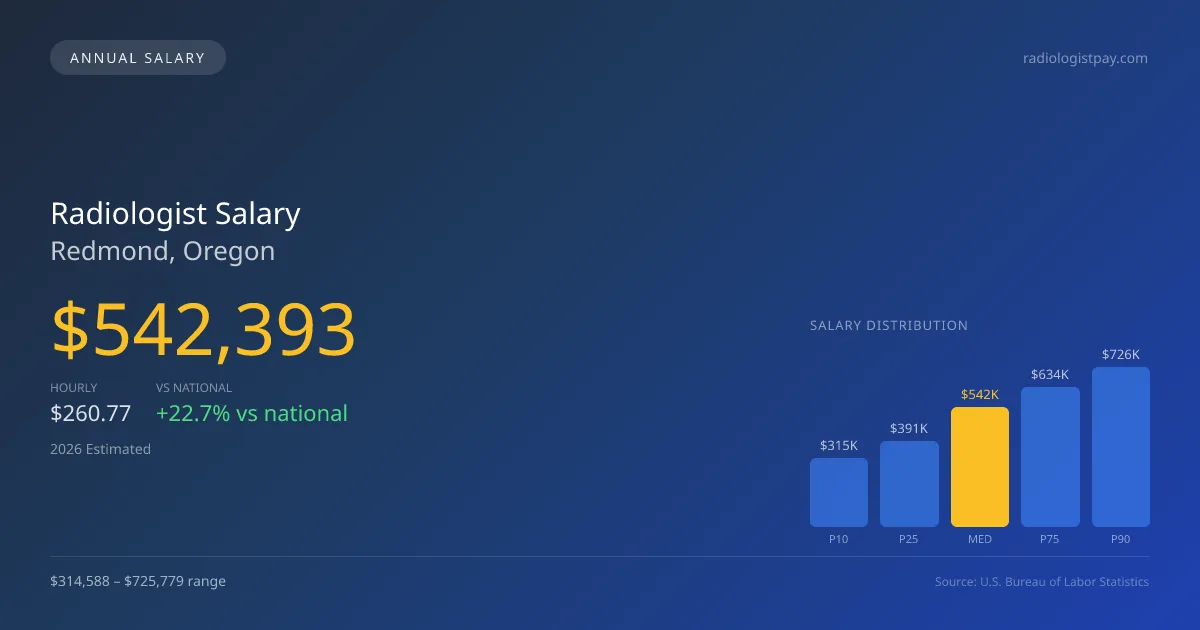
In 2026, the median annual salary for radiologists working in Redmond, Oregon, is projected to be $542,393, significantly exceeding the national median of $441,903 by 22.74%. The salary range in Redmond will vary considerably, with the lowest earners at $314,588, while those at the higher end can reach up to $725,779. These figures are based on 2025 BLS data, projected to 2026, and reflect adjustments for local cost of living factors. Radiologists in Redmond may also enhance their income through teleradiology opportunities, which can contribute effectively to their overall hourly compensation, particularly for those involved in night or weekend coverage, thereby diversifying their revenue streams in a competitive job market.
About the Redmond Market
Salary estimated from Oregon average ($385,000) adjusted for local cost of living.
Salary Breakdown
| Percentile | Annual | Hourly |
|---|---|---|
| Entry Level (P10) | $314,588 | $151.24 |
| Lower Range (P25) | $390,523 | $187.75 |
| Median (P50)(typical) | $542,393 | $260.77 |
| Upper Range (P75) | $634,096 | $304.86 |
| Top Earners (P90) | $725,779 | $348.94 |
Median Salary Position
22.74% above the national average
2026 Salary Percentile Distribution in Redmond
In Redmond, OR, the radiologist salary spread from the 10th to 90th percentile is $411,191 (2026 est.). At $542,393, the local median is 22.74% above the national median of $441,903.
Salary Calculator
At 40 hours/week in Redmond: You'd be above the median
How Redmond Radiologist Pay Compares
Redmond median: $542,393/year (2026)
| Compared To | Median Salary | Redmond Pays |
|---|---|---|
| Oregon Average | $558,018 | -2.80% less |
| National Average | $441,903 | +22.74% more |
Radiologists in Redmond, OR earn a median of $542,393 per year (2026 est.), which is 22.74% higher than the national median of $441,903 and 2.80% below the Oregon state average of $558,018.
Cost-of-Living Adjusted Salary
Redmond has a cost of living 2.60% above the national average.
Adjusted salary = nominal × (100 / CoL index). CoL index: 100 = national average.
Redmond, OR has a cost-of-living index of 102.6 (above the national average of 100). While the nominal salary of $542,393 is competitive, the higher cost of living reduces purchasing power to an effective $528,648 — a 2.53% reduction.
Compare Purchasing Power
Select a city to see how your salary compares after cost of living
Select a city above to compare purchasing power
2021 BLS Actual
$424,979
2025 BLS Actual
$516,565
2026 Current Est.
$542,393
2021–2027 Growth
+34.0%
Salary Trajectory for Radiologists in Redmond (2021–2027)
2021–2025: actual BLS OEWS data for this metro area. 2026+: CAGR 5.00% projection.
| Year | Annual Salary | Status |
|---|---|---|
| 2021 | $424,979 | Actual |
| 2022 | $446,228 | Actual |
| 2023 | $468,540 | Actual |
| 2024 | $383,911 | Actual |
| 2025 | $516,565 | Actual |
| 2026(current) | $542,393 | Estimated |
| 2027 | $569,513 | Projected |
Based on 5 years of BLS OEWS data for the Redmond metropolitan area, the median radiologist salary grew 21.6% from $424,979 (2021) to $516,565 (2025). At a 5.00% compound annual growth rate, salaries are projected to reach $569,513 by 2027 — a total increase of $144,534 (34.01%) from 2021.
Note: Historical values (2021–2025) are actual BLS OEWS figures for the Redmond metropolitan area, sourced from annual Occupational Employment and Wage Statistics surveys. 2026–2026 figures are current estimates, and 2027 values are projections, calculated using a 5.00% CAGR derived from 5-year BLS historical data. Actual salaries may vary based on employer, experience, certifications, and local market conditions.
Salary by Experience Level
| Experience | Estimated Salary Range |
|---|---|
| 0-2 years (New Graduate) | $314,588 – $390,523 |
| 3-5 years (Mid Career) | $390,523 – $542,393 |
| 5+ years (Experienced) | $542,393 – $634,096 |
| 10+ years (Top Earner) | $634,096 – $725,779 |
MD, DO salary ranges estimated from BLS percentile data. Individual radiologist compensation varies by employer, certifications, and specialization.
Radiologist Job Market in Redmond
Considering the local employment scenario, there are currently five radiologists practicing in Redmond, indicating a somewhat limited job market. While this could restrict opportunities, it also suggests a specialized demand for radiology professionals. With a cost-of-living index of 102.6, salaries must be weighed against local purchasing power, as this figure exceeds the national average, impacting take-home pay. Among the employers in the area, private radiology group practices tend to offer the highest compensation, especially for those operating within a partnership model compared to W-2 hospital employment. Variability in pay is influenced by a range of factors such as RVU productivity, subspecialty expertise, and the differentiation between night hawk positions and regular shifts. For radiologists seeking to maximize their pay in Redmond, focusing on building a diverse skill set that includes interventional radiology or partnerships with private equity firms can be a strategic move, especially as the landscape of radiology compensation continues to evolve.
More salary data for Redmond, OR:
Frequently Asked Questions
How much do radiologists make in Redmond, OR in 2026?
Is Redmond, OR a good place to work as a radiologist?
Can radiologists make $100K in Redmond?
What is the cost-of-living adjusted radiologist salary in Redmond?
How much does a radiologist make per hour in Redmond?
Related Pages
Compare Salaries
Career Resources
Nearby Cities in Oregon
Written by Dr. Maria Chen, MD
Career Analyst
Dr. Chen has 10 years of experience in diagnostic radiology. She specializes in imaging techniques for oncology. She works at a regional medical center.
Methodology & Data Source
Salary figures on this page are 2026 projections based on the Bureau of Labor Statistics Occupational Employment and Wage Statistics (OEWS) survey, May 2026 release. The BLS reported a median annual salary of $516,565 for radiologistsin the Redmond metropolitan area. A 5.00% compound annual growth rate (CAGR), calculated from 6-year national BLS wage trends, was applied to project current 2026 compensation. Percentile ranges (P10–P90) represent the full salary distribution across experience levels and practice settings in this market.
Data Sources & Methodology
Salary data for Redmond is estimated from official BLS state-level occupational wage data (2025), adjusted for regional cost-of-living differences using BEA RPP (Regional Price Parities).
2026 figures are projected from 2025 BLS data using a compound annual growth rate (CAGR) of 5.00%, derived from historical BLS wage trends for radiologists (SOC 29-1224).
Compiled and verified by Dr. Maria Chen, MD, a licensed radiologist with 10+ years of clinical experience. · View source data at BLS.gov