Radiologist Salary in Grants Pass, OR: $538,886 (2026)
Quick Answer:A full-time radiologist in Grants Pass, OR earns a median $538,886/year (≈ $259.08/hour) in nominal terms for 2026 — projected from BLS OEWS 2025 (SOC 29-1224). Once you factor in Grants Pass's price level (3% above national, BEA RPP 102.6), that paycheck buys what $525,230 would nationally. Nominal pay sits 3.4% below the Oregon state average.
Based on BLS state-level estimates · View source
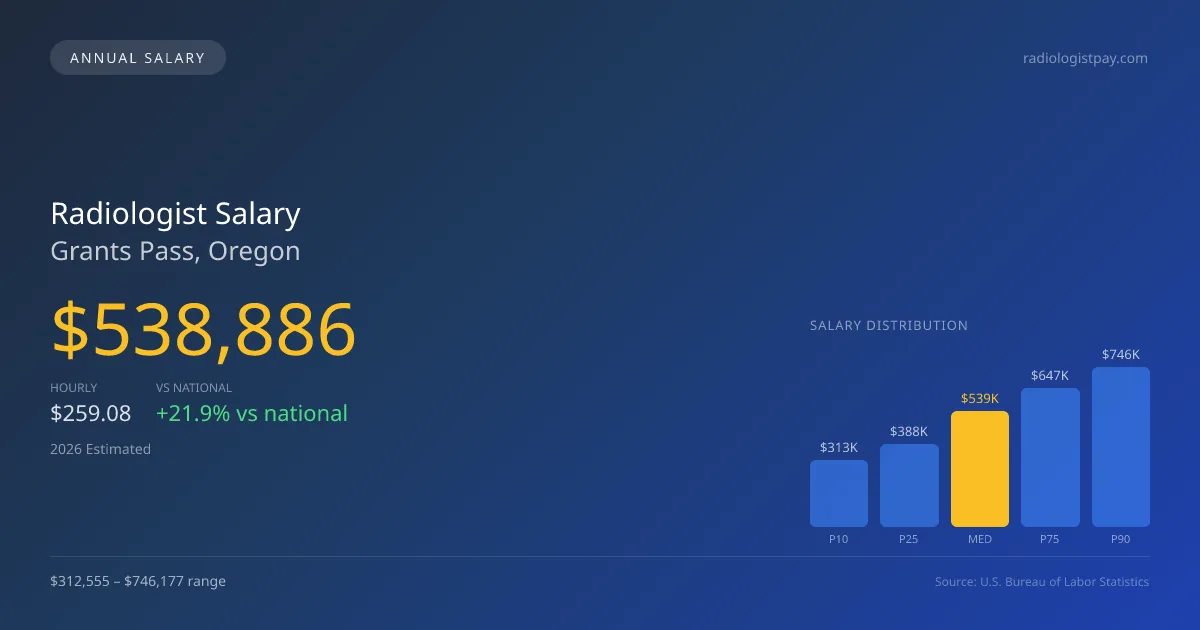
Radiologists entering the Grants Pass market can expect a competitive compensation structure, highlighted by a median salary of $538,886 for 2026. This figure is notable when compared to the national median of $441,903, offering a 21.95% increase. Local salaries span from a low of $312,555 to a high of $746,177, reflecting the diverse subspecialties present, including interventional radiology (IR), general diagnostic practices, and breast imaging. These projections are shaped by estimates derived from state-level data and adjusted for regional economic factors. The job market in Grants Pass is uniquely positioned, allowing radiologists to capitalize on their skills in a city with a favorable compensation landscape.
About the Grants Pass Market
Salary estimated from Oregon average ($385,000) adjusted for local cost of living.
Salary Breakdown
| Percentile | Annual | Hourly |
|---|---|---|
| Entry Level (P10) | $312,555 | $150.27 |
| Lower Range (P25) | $387,998 | $186.53 |
| Median (P50)(typical) | $538,886 | $259.08 |
| Upper Range (P75) | $646,505 | $310.82 |
| Top Earners (P90) | $746,177 | $358.74 |
Median Salary Position
21.95% above the national average
2026 Salary Percentile Distribution in Grants Pass
In Grants Pass, OR, the radiologist salary spread from the 10th to 90th percentile is $433,622 (2026 est.). At $538,886, the local median is 21.95% above the national median of $441,903.
Salary Calculator
At 40 hours/week in Grants Pass: You'd be above the median
How Grants Pass Radiologist Pay Compares
Grants Pass median: $538,886/year (2026)
| Compared To | Median Salary | Grants Pass Pays |
|---|---|---|
| Oregon Average | $557,853 | -3.40% less |
| National Average | $441,903 | +21.95% more |
Radiologists in Grants Pass, OR earn a median of $538,886 per year (2026 est.), which is 21.95% higher than the national median of $441,903 and 3.40% below the Oregon state average of $557,853.
Cost-of-Living Adjusted Salary
Grants Pass has a cost of living 2.60% above the national average.
Adjusted salary = nominal × (100 / CoL index). CoL index: 100 = national average.
Grants Pass, OR has a cost-of-living index of 102.6 (above the national average of 100). While the nominal salary of $538,886 is competitive, the higher cost of living reduces purchasing power to an effective $525,230 — a 2.53% reduction.
Compare Purchasing Power
Select a city to see how your salary compares after cost of living
Select a city above to compare purchasing power
2021 BLS Actual
$422,231
2025 BLS Actual
$513,225
2026 Current Est.
$538,886
2021–2027 Growth
+34.0%
Salary Trajectory for Radiologists in Grants Pass (2021–2027)
2021–2025: actual BLS OEWS data for this metro area. 2026+: CAGR 5.00% projection.
| Year | Annual Salary | Status |
|---|---|---|
| 2021 | $422,231 | Actual |
| 2022 | $443,343 | Actual |
| 2023 | $465,510 | Actual |
| 2024 | $381,428 | Actual |
| 2025 | $513,225 | Actual |
| 2026(current) | $538,886 | Estimated |
| 2027 | $565,831 | Projected |
Based on 5 years of BLS OEWS data for the Grants Pass metropolitan area, the median radiologist salary grew 21.6% from $422,231 (2021) to $513,225 (2025). At a 5.00% compound annual growth rate, salaries are projected to reach $565,831 by 2027 — a total increase of $143,600 (34.01%) from 2021.
Note: Historical values (2021–2025) are actual BLS OEWS figures for the Grants Pass metropolitan area, sourced from annual Occupational Employment and Wage Statistics surveys. 2026–2026 figures are current estimates, and 2027 values are projections, calculated using a 5.00% CAGR derived from 5-year BLS historical data. Actual salaries may vary based on employer, experience, certifications, and local market conditions.
Salary by Experience Level
| Experience | Estimated Salary Range |
|---|---|
| 0-2 years (New Graduate) | $312,555 – $387,998 |
| 3-5 years (Mid Career) | $387,998 – $538,886 |
| 5+ years (Experienced) | $538,886 – $646,505 |
| 10+ years (Top Earner) | $646,505 – $746,177 |
MD, DO salary ranges estimated from BLS percentile data. Individual radiologist compensation varies by employer, certifications, and specialization.
Radiologist Job Market in Grants Pass
As of 2026, Grants Pass hosts seven active radiologists, contributing to a localized yet supportive job market. The cost of living index of 102.6 indicates that while expenses may be slightly higher than the national average, radiologists are still able to maintain a strong purchasing power with their salaries. Most lucrative opportunities typically arise within private radiology group practices, especially for those with partnerships. Moreover, subspecialty expertise, particularly in IR, can command additional compensatory premiums due to higher RVU productivity. Factors driving pay variations include partnership stakes, on-call duties, and supplementary income through teleradiology engagements. To maximize earnings in this specific market, radiologists should focus on cultivating influential partnerships, gaining subspecialization, and staying informed about the evolving dynamics of employment arrangements in the region.
More salary data for Grants Pass, OR:
Frequently Asked Questions
How much do radiologists make in Grants Pass, OR in 2026?
Is Grants Pass, OR a good place to work as a radiologist?
Can radiologists make $100K in Grants Pass?
What is the cost-of-living adjusted radiologist salary in Grants Pass?
How much does a radiologist make per hour in Grants Pass?
Related Pages
Compare Salaries
Career Resources
Nearby Cities in Oregon
Written by Dr. Maria Chen, MD
Career Analyst
Dr. Chen has 10 years of experience in diagnostic radiology. She specializes in imaging techniques for oncology. She works at a regional medical center.
Methodology & Data Source
Salary figures on this page are 2026 projections based on the Bureau of Labor Statistics Occupational Employment and Wage Statistics (OEWS) survey, May 2026 release. The BLS reported a median annual salary of $513,225 for radiologistsin the Grants Pass metropolitan area. A 5.00% compound annual growth rate (CAGR), calculated from 6-year national BLS wage trends, was applied to project current 2026 compensation. Percentile ranges (P10–P90) represent the full salary distribution across experience levels and practice settings in this market.
Data Sources & Methodology
Salary data for Grants Pass is estimated from official BLS state-level occupational wage data (2025), adjusted for regional cost-of-living differences using BEA RPP (Regional Price Parities).
2026 figures are projected from 2025 BLS data using a compound annual growth rate (CAGR) of 5.00%, derived from historical BLS wage trends for radiologists (SOC 29-1224).
Compiled and verified by Dr. Maria Chen, MD, a licensed radiologist with 10+ years of clinical experience. · View source data at BLS.gov