Radiologist Salary in Forest Grove, OR: $544,862 (2026)
Quick Answer:A full-time radiologist in Forest Grove, OR earns a median $544,862/year (≈ $261.95/hour) in nominal terms for 2026 — projected from BLS OEWS 2025 (SOC 29-1224). Once you factor in Forest Grove's price level (3% above national, BEA RPP 102.6), that paycheck buys what $531,055 would nationally. Nominal pay sits 2.4% below the Oregon state average.
Based on BLS state-level estimates · View source
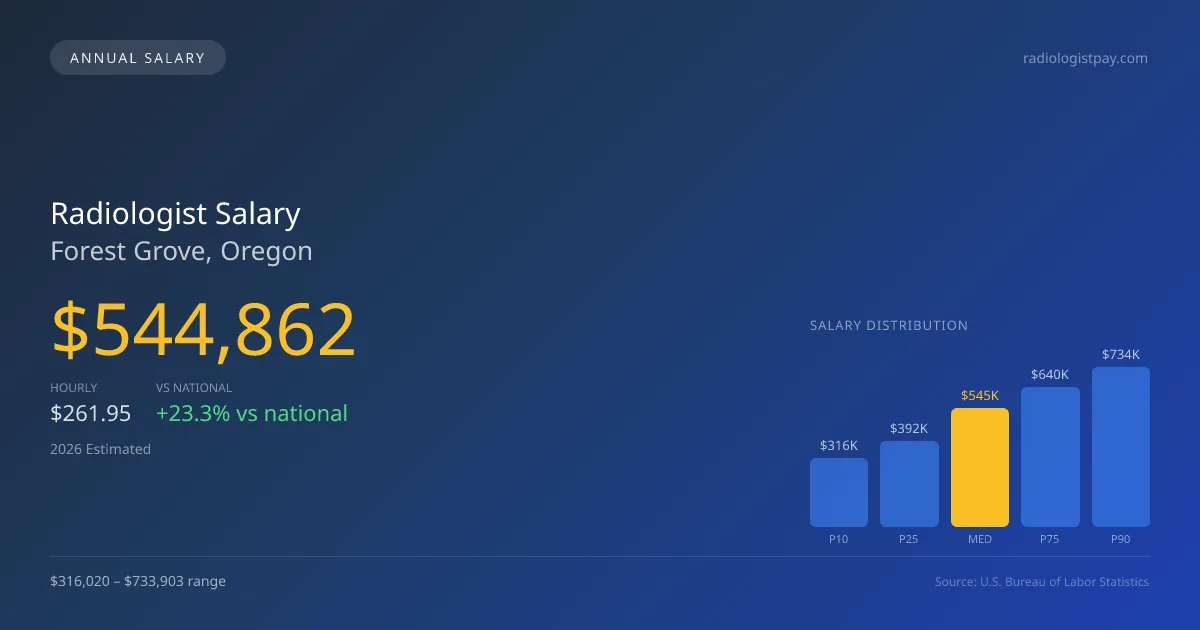
In 2026, the landscape of radiologist salaries in Forest Grove, Oregon, shows a median annual earnings figure of $544,862, which is notably higher by 23.30% compared to the national median of $441,903. The projected salary range for radiologists in the area spans from $316,020 at the 10th percentile to $733,903 at the 90th percentile, indicating a robust earning potential. This variation is influenced by the structural divide between private partnerships and hospital W-2 employment models, which significantly shape and define compensation in this market. These figures are derived from estimates based on 2025 BLS data and adjusted for local cost of living, reflecting the particular economic conditions affecting Forest Grove's job market.
About the Forest Grove Market
Salary estimated from Oregon average ($385,000) adjusted for local cost of living.
Salary Breakdown
| Percentile | Annual | Hourly |
|---|---|---|
| Entry Level (P10) | $316,020 | $151.94 |
| Lower Range (P25) | $392,301 | $188.61 |
| Median (P50)(typical) | $544,862 | $261.95 |
| Upper Range (P75) | $639,918 | $307.65 |
| Top Earners (P90) | $733,903 | $352.84 |
Median Salary Position
23.30% above the national average
2026 Salary Percentile Distribution in Forest Grove
In Forest Grove, OR, the radiologist salary spread from the 10th to 90th percentile is $417,883 (2026 est.). At $544,862, the local median is 23.3% above the national median of $441,903.
Salary Calculator
At 40 hours/week in Forest Grove: You'd be above the median
How Forest Grove Radiologist Pay Compares
Forest Grove median: $544,862/year (2026)
| Compared To | Median Salary | Forest Grove Pays |
|---|---|---|
| Oregon Average | $558,260 | -2.40% less |
| National Average | $441,903 | +23.30% more |
Radiologists in Forest Grove, OR earn a median of $544,862 per year (2026 est.), which is 23.30% higher than the national median of $441,903 and 2.40% below the Oregon state average of $558,260.
Cost-of-Living Adjusted Salary
Forest Grove has a cost of living 2.60% above the national average.
Adjusted salary = nominal × (100 / CoL index). CoL index: 100 = national average.
Forest Grove, OR has a cost-of-living index of 102.6 (above the national average of 100). While the nominal salary of $544,862 is competitive, the higher cost of living reduces purchasing power to an effective $531,055 — a 2.53% reduction.
Compare Purchasing Power
Select a city to see how your salary compares after cost of living
Select a city above to compare purchasing power
2021 BLS Actual
$426,913
2025 BLS Actual
$518,916
2026 Current Est.
$544,862
2021–2027 Growth
+34.0%
Salary Trajectory for Radiologists in Forest Grove (2021–2027)
2021–2025: actual BLS OEWS data for this metro area. 2026+: CAGR 5.00% projection.
| Year | Annual Salary | Status |
|---|---|---|
| 2021 | $426,913 | Actual |
| 2022 | $448,259 | Actual |
| 2023 | $470,672 | Actual |
| 2024 | $385,658 | Actual |
| 2025 | $518,916 | Actual |
| 2026(current) | $544,862 | Estimated |
| 2027 | $572,105 | Projected |
Based on 5 years of BLS OEWS data for the Forest Grove metropolitan area, the median radiologist salary grew 21.6% from $426,913 (2021) to $518,916 (2025). At a 5.00% compound annual growth rate, salaries are projected to reach $572,105 by 2027 — a total increase of $145,192 (34.01%) from 2021.
Note: Historical values (2021–2025) are actual BLS OEWS figures for the Forest Grove metropolitan area, sourced from annual Occupational Employment and Wage Statistics surveys. 2026–2026 figures are current estimates, and 2027 values are projections, calculated using a 5.00% CAGR derived from 5-year BLS historical data. Actual salaries may vary based on employer, experience, certifications, and local market conditions.
Salary by Experience Level
| Experience | Estimated Salary Range |
|---|---|
| 0-2 years (New Graduate) | $316,020 – $392,301 |
| 3-5 years (Mid Career) | $392,301 – $544,862 |
| 5+ years (Experienced) | $544,862 – $639,918 |
| 10+ years (Top Earner) | $639,918 – $733,903 |
MD, DO salary ranges estimated from BLS percentile data. Individual radiologist compensation varies by employer, certifications, and specialization.
Radiologist Job Market in Forest Grove
With only four radiologists currently employed in Forest Grove, the local job market remains relatively small but promising, especially in light of the cost of living index standing at 102.6, which is slightly above the national average. This reality underscores the necessity for radiologists to consider how much do radiologists make in Forest Grove when assessing their take-home purchasing power. Among local employers, private radiology group practices typically offer the highest compensation, particularly for those with partnership equity arrangements which drive earnings upwards. Factors such as RVU productivity, subspecialty mix—where interventional radiology can command substantial premiums—and opportunities for secondary income through teleradiology firms contribute to the salary spread. Radiologists can maximize their financial prospects by focusing on specialized skill sets, particularly in subspecialties, and exploring partnership opportunities, thereby enhancing their earning potential in the Forest Grove OR market.
More salary data for Forest Grove, OR:
Frequently Asked Questions
How much do radiologists make in Forest Grove, OR in 2026?
Is Forest Grove, OR a good place to work as a radiologist?
Can radiologists make $100K in Forest Grove?
What is the cost-of-living adjusted radiologist salary in Forest Grove?
How much does a radiologist make per hour in Forest Grove?
Related Pages
Compare Salaries
Career Resources
Nearby Cities in Oregon
Written by Dr. Maria Chen, MD
Career Analyst
Dr. Chen has 10 years of experience in diagnostic radiology. She specializes in imaging techniques for oncology. She works at a regional medical center.
Methodology & Data Source
Salary figures on this page are 2026 projections based on the Bureau of Labor Statistics Occupational Employment and Wage Statistics (OEWS) survey, May 2026 release. The BLS reported a median annual salary of $518,916 for radiologistsin the Forest Grove metropolitan area. A 5.00% compound annual growth rate (CAGR), calculated from 6-year national BLS wage trends, was applied to project current 2026 compensation. Percentile ranges (P10–P90) represent the full salary distribution across experience levels and practice settings in this market.
Data Sources & Methodology
Salary data for Forest Grove is estimated from official BLS state-level occupational wage data (2025), adjusted for regional cost-of-living differences using BEA RPP (Regional Price Parities).
2026 figures are projected from 2025 BLS data using a compound annual growth rate (CAGR) of 5.00%, derived from historical BLS wage trends for radiologists (SOC 29-1224).
Compiled and verified by Dr. Maria Chen, MD, a licensed radiologist with 10+ years of clinical experience. · View source data at BLS.gov