Radiologist Salary in Sand Springs, OK: $361,083 (2026)
Quick Answer:A full-time radiologist in Sand Springs, OK earns a median $361,083/year (≈ $173.60/hour) in nominal terms for 2026 — projected from BLS OEWS 2025 (SOC 29-1224). Once you factor in Sand Springs's price level (11% below national, BEA RPP 88.9), that paycheck buys what $406,168 would nationally. Nominal pay sits 8.1% below the Oklahoma state average.
Based on BLS state-level estimates · View source
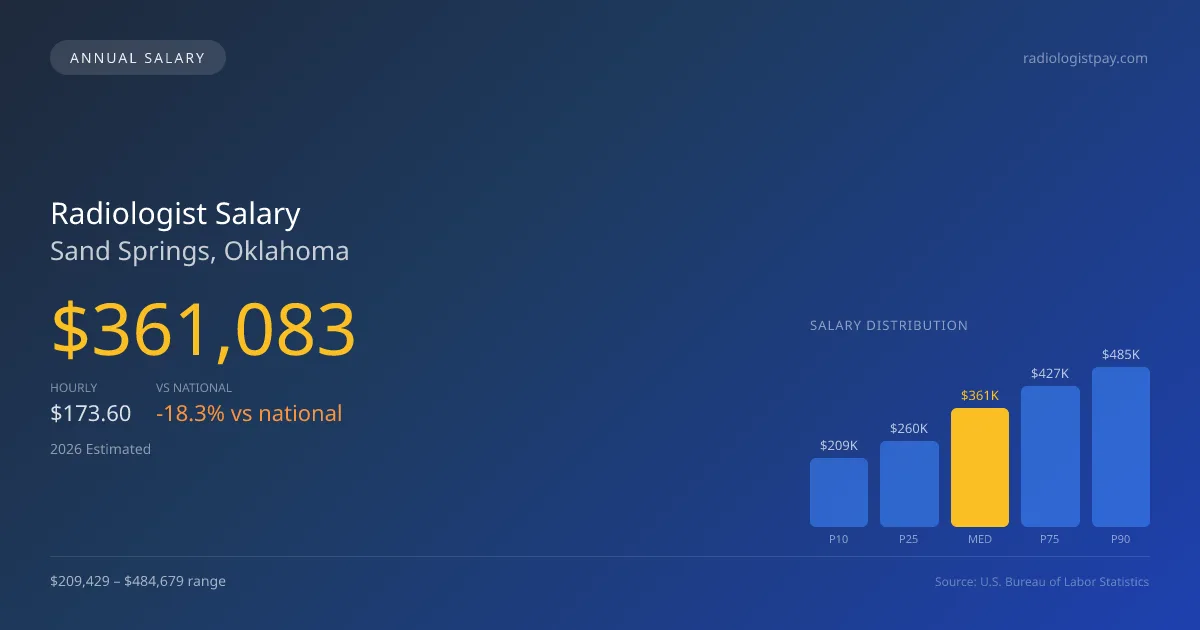
In 2026, the projected radiologist salary in Sand Springs, Oklahoma, stands at $361,083 per year, which falls short of the national median of $441,903 by about 18.29%. The range for local radiologist pay varies significantly, with earnings from $209,429 for the bottom 10% to as much as $484,679 for the top 10%. Such disparities also reflect the local job market's unique dynamics. Teleradiology as a side income stream can enhance effective hourly compensation, allowing radiologists to contribute more flexibly during off-hours, which can be particularly appealing in a smaller market like Sand Springs.
About the Sand Springs Market
Salary estimated from Oklahoma average ($345,000) adjusted for local cost of living.
Salary Breakdown
| Percentile | Annual | Hourly |
|---|---|---|
| Entry Level (P10) | $209,429 | $100.68 |
| Lower Range (P25) | $259,980 | $124.99 |
| Median (P50)(typical) | $361,083 | $173.60 |
| Upper Range (P75) | $426,543 | $205.07 |
| Top Earners (P90) | $484,679 | $233.02 |
Median Salary Position
18.29% below the national average
2026 Salary Percentile Distribution in Sand Springs
In Sand Springs, OK, the radiologist salary spread from the 10th to 90th percentile is $275,250 (2026 est.). At $361,083, the local median is 18.29% below the national median of $441,903.
Salary Calculator
At 40 hours/week in Sand Springs: You'd be above the median
How Sand Springs Radiologist Pay Compares
Sand Springs median: $361,083/year (2026)
| Compared To | Median Salary | Sand Springs Pays |
|---|---|---|
| Oklahoma Average | $392,909 | -8.10% less |
| National Average | $441,903 | -18.29% less |
Radiologists in Sand Springs, OK earn a median of $361,083 per year (2026 est.), which is 18.29% lower than the national median of $441,903 and 8.10% below the Oklahoma state average of $392,909.
Cost-of-Living Adjusted Salary
Sand Springs has a cost of living 11.10% below the national average, meaning your salary goes further here.
Adjusted salary = nominal × (100 / CoL index). CoL index: 100 = national average.
Sand Springs, OK has a cost-of-living index of 88.9 (below the national average of 100). A radiologist earning $361,083 nominally has purchasing power equivalent to $406,168 in an average-cost city — an effective 12.49% boost.
Compare Purchasing Power
Select a city to see how your salary compares after cost of living
Select a city above to compare purchasing power
2021 BLS Actual
$282,918
2025 BLS Actual
$343,889
2026 Current Est.
$361,083
2021–2027 Growth
+34.0%
Salary Trajectory for Radiologists in Sand Springs (2021–2027)
2021–2025: actual BLS OEWS data for this metro area. 2026+: CAGR 5.00% projection.
| Year | Annual Salary | Status |
|---|---|---|
| 2021 | $282,918 | Actual |
| 2022 | $297,064 | Actual |
| 2023 | $311,917 | Actual |
| 2024 | $281,902 | Actual |
| 2025 | $343,889 | Actual |
| 2026(current) | $361,083 | Estimated |
| 2027 | $379,138 | Projected |
Based on 5 years of BLS OEWS data for the Sand Springs metropolitan area, the median radiologist salary grew 21.6% from $282,918 (2021) to $343,889 (2025). At a 5.00% compound annual growth rate, salaries are projected to reach $379,138 by 2027 — a total increase of $96,220 (34.01%) from 2021.
Note: Historical values (2021–2025) are actual BLS OEWS figures for the Sand Springs metropolitan area, sourced from annual Occupational Employment and Wage Statistics surveys. 2026–2026 figures are current estimates, and 2027 values are projections, calculated using a 5.00% CAGR derived from 5-year BLS historical data. Actual salaries may vary based on employer, experience, certifications, and local market conditions.
Salary by Experience Level
| Experience | Estimated Salary Range |
|---|---|
| 0-2 years (New Graduate) | $209,429 – $259,980 |
| 3-5 years (Mid Career) | $259,980 – $361,083 |
| 5+ years (Experienced) | $361,083 – $426,543 |
| 10+ years (Top Earner) | $426,543 – $484,679 |
MD, DO salary ranges estimated from BLS percentile data. Individual radiologist compensation varies by employer, certifications, and specialization.
Radiologist Job Market in Sand Springs
With only six radiologists currently employed in Sand Springs, the local market shows a concentrated demand for diagnostic services. The cost of living index here at 88.9 indicates that physicians might enjoy a relatively comfortable lifestyle compared to national averages. In terms of compensation, partners in private radiology practices may often earn more than those employed by hospitals or academic institutions due to challenges associated with RVU productivity models, covering night and weekend shifts, or generating revenue through teleradiology. Subspecialization, particularly in interventional radiology, typically commands a premium that can further impact earnings. To maximize pay in this market, pursuing a subspecialty, engaging in teleradiology, and considering partnership opportunities within private practices may be effective strategies for career advancement and financial gain.
More salary data for Sand Springs, OK:
Frequently Asked Questions
How much do radiologists make in Sand Springs, OK in 2026?
Is Sand Springs, OK a good place to work as a radiologist?
Can radiologists make $100K in Sand Springs?
What is the cost-of-living adjusted radiologist salary in Sand Springs?
How much does a radiologist make per hour in Sand Springs?
Related Pages
Compare Salaries
Career Resources
Nearby Cities in Oklahoma
Written by Dr. Maria Chen, MD
Career Analyst
Dr. Chen has 10 years of experience in diagnostic radiology. She specializes in imaging techniques for oncology. She works at a regional medical center.
Methodology & Data Source
Salary figures on this page are 2026 projections based on the Bureau of Labor Statistics Occupational Employment and Wage Statistics (OEWS) survey, May 2026 release. The BLS reported a median annual salary of $343,889 for radiologistsin the Sand Springs metropolitan area. A 5.00% compound annual growth rate (CAGR), calculated from 6-year national BLS wage trends, was applied to project current 2026 compensation. Percentile ranges (P10–P90) represent the full salary distribution across experience levels and practice settings in this market.
Data Sources & Methodology
Salary data for Sand Springs is estimated from official BLS state-level occupational wage data (2025), adjusted for regional cost-of-living differences using BEA RPP (Regional Price Parities).
2026 figures are projected from 2025 BLS data using a compound annual growth rate (CAGR) of 5.00%, derived from historical BLS wage trends for radiologists (SOC 29-1224).
Compiled and verified by Dr. Maria Chen, MD, a licensed radiologist with 10+ years of clinical experience. · View source data at BLS.gov