Radiologist Salary in Nashua, NH: $550,124 (2026)
Quick Answer:A full-time radiologist in Nashua, NH earns a median $550,124/year (≈ $264.48/hour) in nominal terms for 2026 — projected from BLS OEWS 2025 (SOC 29-1224). Once you factor in Nashua's price level (7% above national, BEA RPP 107.3), that paycheck buys what $512,697 would nationally. Nominal pay sits 0.3% below the New Hampshire state average.
Based on BLS state-level estimates · View source
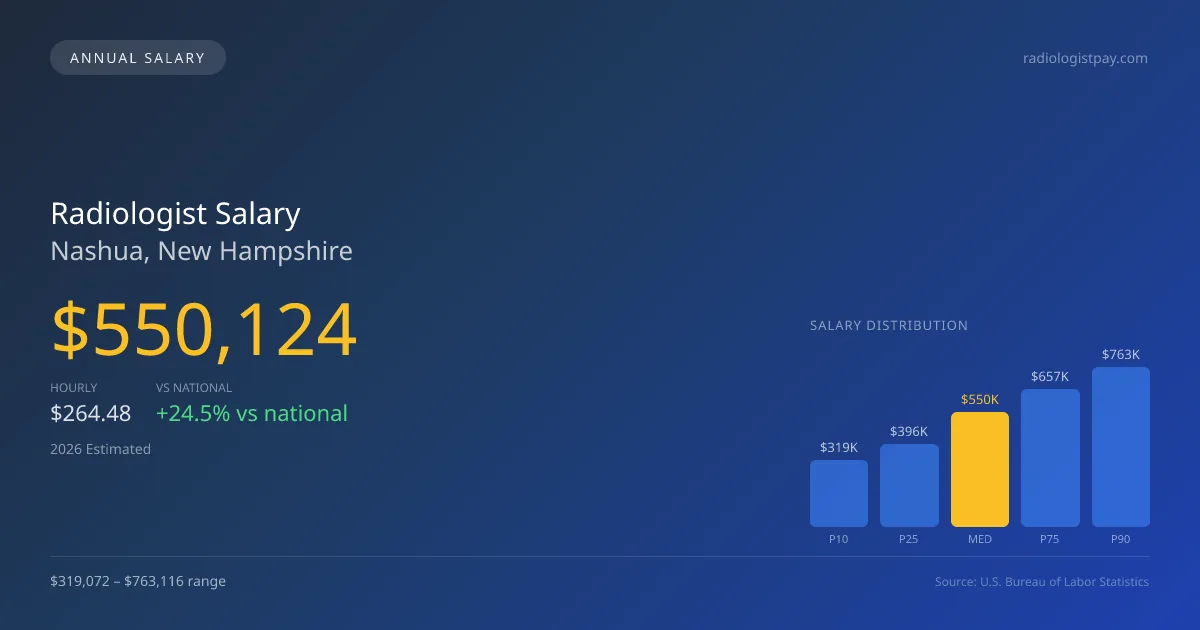
In 2026, the median annual salary for a radiologist in Nashua, New Hampshire, is projected at $550,124, significantly higher than the national median of $441,903. This reflects a compelling 24.49% premium for local professionals in the field. Salaries vary widely, ranging from $319,072 at the 10th percentile to $763,116 at the 90th percentile. These figures, derived from 2025 BLS data and adjusted for local cost of living factors, highlight the differences between private partnerships and hospital W-2 employment structures. As the market evolves and private equity firms influence practice models, the competitive landscape for radiologist pay in Nashua is increasingly shaped by individual negotiations and the potential for practice ownership.
About the Nashua Market
Salary estimated from New Hampshire average ($385,000) adjusted for local cost of living.
Salary Breakdown
| Percentile | Annual | Hourly |
|---|---|---|
| Entry Level (P10) | $319,072 | $153.41 |
| Lower Range (P25) | $396,089 | $190.43 |
| Median (P50)(typical) | $550,124 | $264.48 |
| Upper Range (P75) | $657,229 | $315.98 |
| Top Earners (P90) | $763,116 | $366.88 |
Median Salary Position
24.49% above the national average
2026 Salary Percentile Distribution in Nashua
In Nashua, NH, the radiologist salary spread from the 10th to 90th percentile is $444,044 (2026 est.). At $550,124, the local median is 24.49% above the national median of $441,903.
Salary Calculator
At 40 hours/week in Nashua: You'd be above the median
How Nashua Radiologist Pay Compares
Nashua median: $550,124/year (2026)
| Compared To | Median Salary | Nashua Pays |
|---|---|---|
| New Hampshire Average | $551,780 | -0.30% less |
| National Average | $441,903 | +24.49% more |
Radiologists in Nashua, NH earn a median of $550,124 per year (2026 est.), which is 24.49% higher than the national median of $441,903 and 0.30% below the New Hampshire state average of $551,780.
Cost-of-Living Adjusted Salary
Nashua has a cost of living 7.30% above the national average.
Adjusted salary = nominal × (100 / CoL index). CoL index: 100 = national average.
Nashua, NH has a cost-of-living index of 107.3 (above the national average of 100). While the nominal salary of $550,124 is competitive, the higher cost of living reduces purchasing power to an effective $512,697 — a 6.8% reduction.
Compare Purchasing Power
Select a city to see how your salary compares after cost of living
Select a city above to compare purchasing power
2021 BLS Actual
$431,037
2025 BLS Actual
$523,928
2026 Current Est.
$550,124
2021–2027 Growth
+34.0%
Salary Trajectory for Radiologists in Nashua (2021–2027)
2021–2025: actual BLS OEWS data for this metro area. 2026+: CAGR 5.00% projection.
| Year | Annual Salary | Status |
|---|---|---|
| 2021 | $431,037 | Actual |
| 2022 | $452,589 | Actual |
| 2023 | $475,218 | Actual |
| 2024 | $411,869 | Actual |
| 2025 | $523,928 | Actual |
| 2026(current) | $550,124 | Estimated |
| 2027 | $577,631 | Projected |
Based on 5 years of BLS OEWS data for the Nashua metropolitan area, the median radiologist salary grew 21.6% from $431,037 (2021) to $523,928 (2025). At a 5.00% compound annual growth rate, salaries are projected to reach $577,631 by 2027 — a total increase of $146,594 (34.01%) from 2021.
Note: Historical values (2021–2025) are actual BLS OEWS figures for the Nashua metropolitan area, sourced from annual Occupational Employment and Wage Statistics surveys. 2026–2026 figures are current estimates, and 2027 values are projections, calculated using a 5.00% CAGR derived from 5-year BLS historical data. Actual salaries may vary based on employer, experience, certifications, and local market conditions.
Salary by Experience Level
| Experience | Estimated Salary Range |
|---|---|
| 0-2 years (New Graduate) | $319,072 – $396,089 |
| 3-5 years (Mid Career) | $396,089 – $550,124 |
| 5+ years (Experienced) | $550,124 – $657,229 |
| 10+ years (Top Earner) | $657,229 – $763,116 |
MD, DO salary ranges estimated from BLS percentile data. Individual radiologist compensation varies by employer, certifications, and specialization.
Radiologist Job Market in Nashua
With a local employment base of 21 radiologists, the job market in Nashua has its unique characteristics that affect compensation. The cost of living index sits at 107.3, indicating that while salaries are robust, the take-home purchasing power may be moderately impacted by local expenses. Typically, higher salaries can be found in private radiology group practices or through teleradiology firms that offer 1099 contracts for overnight coverage. Factors such as RVU productivity, subspecialty focus—particularly interventional radiology, which commands a significant premium—and the distinction between W-2 roles and partnership opportunities drive the salary spread. To effectively maximize their earnings, radiologists in Nashua should consider focusing on higher-demand subspecialties, aiming for roles within private practice settings, and negotiating terms that capitalize on their productivity and availability for night and weekend shifts.
More salary data for Nashua, NH:
Frequently Asked Questions
How much do radiologists make in Nashua, NH in 2026?
Is Nashua, NH a good place to work as a radiologist?
Can radiologists make $100K in Nashua?
What is the cost-of-living adjusted radiologist salary in Nashua?
How much does a radiologist make per hour in Nashua?
Related Pages
Compare Salaries
Career Resources
Nearby Cities in New Hampshire
Written by Dr. Maria Chen, MD
Career Analyst
Dr. Chen has 10 years of experience in diagnostic radiology. She specializes in imaging techniques for oncology. She works at a regional medical center.
Methodology & Data Source
Salary figures on this page are 2026 projections based on the Bureau of Labor Statistics Occupational Employment and Wage Statistics (OEWS) survey, May 2026 release. The BLS reported a median annual salary of $523,928 for radiologistsin the Nashua metropolitan area. A 5.00% compound annual growth rate (CAGR), calculated from 6-year national BLS wage trends, was applied to project current 2026 compensation. Percentile ranges (P10–P90) represent the full salary distribution across experience levels and practice settings in this market.
Data Sources & Methodology
Salary data for Nashua is estimated from official BLS state-level occupational wage data (2025), adjusted for regional cost-of-living differences using BEA RPP (Regional Price Parities).
2026 figures are projected from 2025 BLS data using a compound annual growth rate (CAGR) of 5.00%, derived from historical BLS wage trends for radiologists (SOC 29-1224).
Compiled and verified by Dr. Maria Chen, MD, a licensed radiologist with 10+ years of clinical experience. · View source data at BLS.gov