Radiologist Salary in Norfolk, NE: $429,779 (2026)
Quick Answer:A full-time radiologist in Norfolk, NE earns a median $429,779/year (≈ $206.63/hour) in nominal terms for 2026 — projected from BLS OEWS 2025 (SOC 29-1224). Once you factor in Norfolk's price level (8% below national, BEA RPP 91.5), that paycheck buys what $469,704 would nationally. Nominal pay sits 6.9% below the Nebraska state average.
Based on BLS state-level estimates · View source
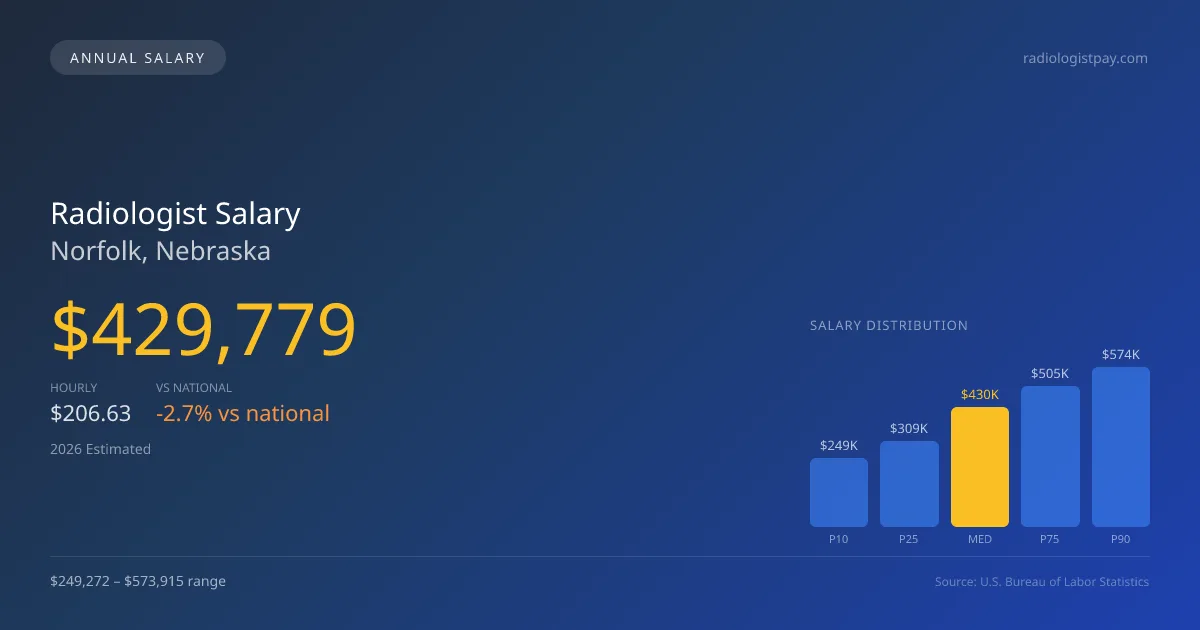
In 2026, radiologists in Norfolk, Nebraska, can expect to earn a median annual salary of $429,779, reflecting a competitive pay structure shaped by the local healthcare environment. The salary range for this profession varies considerably, from $249,272 at the 10th percentile to $573,915 at the 90th percentile, indicating significant earning potential based on factors such as experience, subspecialty, and the type of employment. These estimates are informed by BLS state-level data and regional cost adjustments, revealing that while the pay may seem lower compared to the national median of $441,903, the structural divide between private practice and hospital employment creates distinct compensation dynamics in Norfolk.
About the Norfolk Market
Salary estimated from Nebraska average ($355,000) adjusted for local cost of living.
Salary Breakdown
| Percentile | Annual | Hourly |
|---|---|---|
| Entry Level (P10) | $249,272 | $119.85 |
| Lower Range (P25) | $309,440 | $148.77 |
| Median (P50)(typical) | $429,779 | $206.63 |
| Upper Range (P75) | $504,891 | $242.74 |
| Top Earners (P90) | $573,915 | $275.92 |
Median Salary Position
2.74% below the national average
2026 Salary Percentile Distribution in Norfolk
In Norfolk, NE, the radiologist salary spread from the 10th to 90th percentile is $324,643 (2026 est.). At $429,779, the local median is 2.74% below the national median of $441,903.
Salary Calculator
At 40 hours/week in Norfolk: You'd be above the median
How Norfolk Radiologist Pay Compares
Norfolk median: $429,779/year (2026)
| Compared To | Median Salary | Norfolk Pays |
|---|---|---|
| Nebraska Average | $461,631 | -6.90% less |
| National Average | $441,903 | -2.74% less |
Radiologists in Norfolk, NE earn a median of $429,779 per year (2026 est.), which is 2.74% lower than the national median of $441,903 and 6.90% below the Nebraska state average of $461,631.
Cost-of-Living Adjusted Salary
Norfolk has a cost of living 8.50% below the national average, meaning your salary goes further here.
Adjusted salary = nominal × (100 / CoL index). CoL index: 100 = national average.
Norfolk, NE has a cost-of-living index of 91.5 (below the national average of 100). A radiologist earning $429,779 nominally has purchasing power equivalent to $469,704 in an average-cost city — an effective 9.29% boost.
Compare Purchasing Power
Select a city to see how your salary compares after cost of living
Select a city above to compare purchasing power
2021 BLS Actual
$336,743
2025 BLS Actual
$409,313
2026 Current Est.
$429,779
2021–2027 Growth
+34.0%
Salary Trajectory for Radiologists in Norfolk (2021–2027)
2021–2025: actual BLS OEWS data for this metro area. 2026+: CAGR 5.00% projection.
| Year | Annual Salary | Status |
|---|---|---|
| 2021 | $336,743 | Actual |
| 2022 | $353,580 | Actual |
| 2023 | $371,259 | Actual |
| 2024 | $302,514 | Actual |
| 2025 | $409,313 | Actual |
| 2026(current) | $429,779 | Estimated |
| 2027 | $451,268 | Projected |
Based on 5 years of BLS OEWS data for the Norfolk metropolitan area, the median radiologist salary grew 21.6% from $336,743 (2021) to $409,313 (2025). At a 5.00% compound annual growth rate, salaries are projected to reach $451,268 by 2027 — a total increase of $114,525 (34.01%) from 2021.
Note: Historical values (2021–2025) are actual BLS OEWS figures for the Norfolk metropolitan area, sourced from annual Occupational Employment and Wage Statistics surveys. 2026–2026 figures are current estimates, and 2027 values are projections, calculated using a 5.00% CAGR derived from 5-year BLS historical data. Actual salaries may vary based on employer, experience, certifications, and local market conditions.
Salary by Experience Level
| Experience | Estimated Salary Range |
|---|---|
| 0-2 years (New Graduate) | $249,272 – $309,440 |
| 3-5 years (Mid Career) | $309,440 – $429,779 |
| 5+ years (Experienced) | $429,779 – $504,891 |
| 10+ years (Top Earner) | $504,891 – $573,915 |
MD, DO salary ranges estimated from BLS percentile data. Individual radiologist compensation varies by employer, certifications, and specialization.
Radiologist Job Market in Norfolk
As of now, Norfolk employs six radiologists, a relatively small workforce that underscores the competitive nature of the local job market. The cost of living index stands at 91.5, offering a more affordable lifestyle compared to many other regions — a factor that increases effective take-home pay despite the lower salary averages. Among local employers, private radiology practices tend to offer the most lucrative compensation opportunities, particularly for established radiologists who can participate in partnerships, as these roles often exceed typical hospital-employed positions. Factors driving salary variation include productivity-based pay models, subspecialty skills (such as interventional radiology commanding higher rates), and additional income opportunities through teleradiology. For those looking to maximize their radiologist pay in Norfolk, pursuing performance incentives, developing a subspecialty expertise, and understanding the nuances of partnership versus W-2 employment can be effective strategies in this evolving market.
More salary data for Norfolk, NE:
Frequently Asked Questions
How much do radiologists make in Norfolk, NE in 2026?
Is Norfolk, NE a good place to work as a radiologist?
Can radiologists make $100K in Norfolk?
What is the cost-of-living adjusted radiologist salary in Norfolk?
How much does a radiologist make per hour in Norfolk?
Related Pages
Compare Salaries
Career Resources
Nearby Cities in Nebraska
Written by Dr. Maria Chen, MD
Career Analyst
Dr. Chen has 10 years of experience in diagnostic radiology. She specializes in imaging techniques for oncology. She works at a regional medical center.
Methodology & Data Source
Salary figures on this page are 2026 projections based on the Bureau of Labor Statistics Occupational Employment and Wage Statistics (OEWS) survey, May 2026 release. The BLS reported a median annual salary of $409,313 for radiologistsin the Norfolk metropolitan area. A 5.00% compound annual growth rate (CAGR), calculated from 6-year national BLS wage trends, was applied to project current 2026 compensation. Percentile ranges (P10–P90) represent the full salary distribution across experience levels and practice settings in this market.
Data Sources & Methodology
Salary data for Norfolk is estimated from official BLS state-level occupational wage data (2025), adjusted for regional cost-of-living differences using BEA RPP (Regional Price Parities).
2026 figures are projected from 2025 BLS data using a compound annual growth rate (CAGR) of 5.00%, derived from historical BLS wage trends for radiologists (SOC 29-1224).
Compiled and verified by Dr. Maria Chen, MD, a licensed radiologist with 10+ years of clinical experience. · View source data at BLS.gov