Radiologist Salary in Montana: $513,230 (2026)
Quick Answer:Across Montana's 7 metropolitan areas, the average median radiologist pay sits at $513,230/year heading into 2026 — a figure projected from 2025 BLS OEWS wage data for SOC 29-1224. Because Montana sits at BEA RPP 96.2 (4% below the U.S. baseline), that statewide median translates to roughly $533,503 in nationally-comparable purchasing power. Highest-paying metros: Billings ($506,800), Great Falls ($490,186), Bozeman ($483,646).
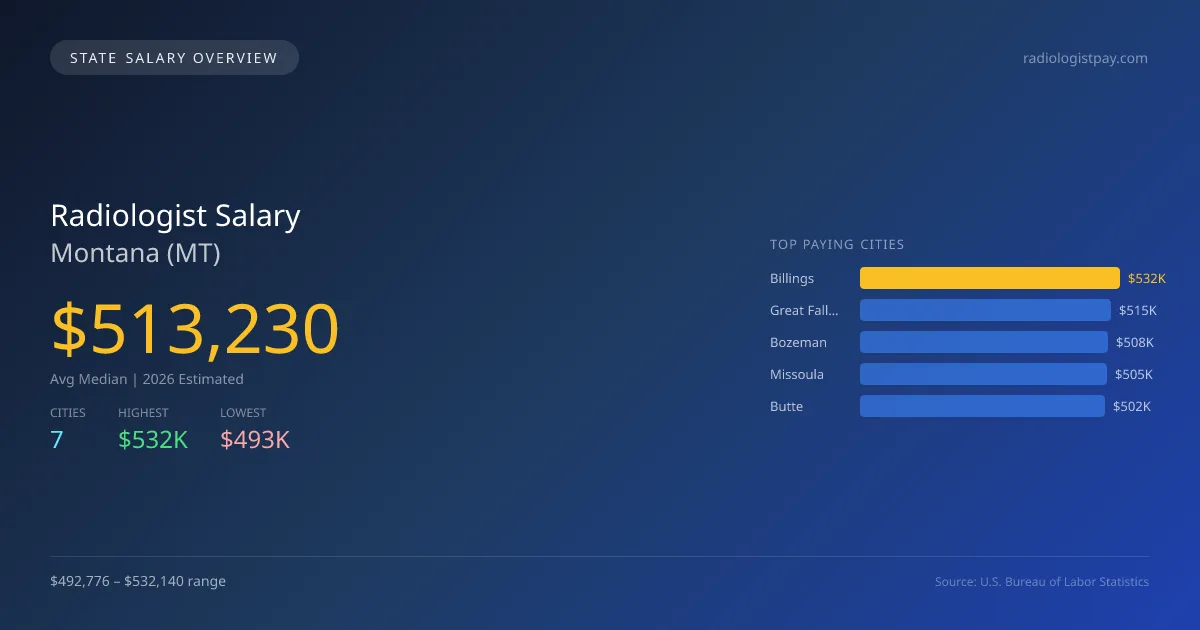
In Montana, the projected average median salary for radiologists in 2026 is $513,230, reflecting a significant increase of 16.1% over the national median of $441,903. The highest-paying city in the state is Billings, where radiologists can expect to earn $532,140, while the lowest is Kalispell, with salaries at $492,776. This $39,364 salary gap can be attributed to differences in local demand, cost of living, and the concentration of healthcare facilities. Montana's state licensing requirements and scope of practice laws align with national standards, ensuring that radiologists can practice effectively within their field. The demand for radiology services is driven by the state's rural healthcare needs and an overall population growth rate of 5.00%. The job market for radiologists in Montana is projected to see an annual growth rate of 5.00%, indicating a steady demand for professionals as healthcare facilities expand to meet patient needs. Other top paying cities in Montana include Great Falls at $514,695, Bozeman at $507,828, Missoula at $504,681, and Butte at $501,534, further demonstrating diversity within the state's pathology landscape. This information emphasizes Montana's evolving healthcare environment and opportunities for radiologists.
Montana Radiologist Salary Range
Overall salary range in Montana: $285,810 (lowest entry-level) to $748,310 (highest top earner)
Montana vs National Average
Montana radiologists earn 16.14% more than the national median (+$71,327/year difference).
Montana Radiologist Salary Distribution (2026)
Radiologist salaries in Montana range from $297,673 (entry-level, 10th percentile) to $726,029 (top earners, 90th percentile), with a median of $513,230. The Montana median is $71,327 above the US national median of $441,903. The average hourly rate is $246.74/hr. Approximately 86 radiologists are employed across 7 cities.
2021 BLS Actual
$402,129
2025 BLS Actual
$488,790
2026 Current Est.
$513,230
2021–2027 Growth
+34.0%
Salary Trajectory for Radiologists in Montana (2021–2027)
2021–2025: actual BLS OEWS data for this metro area. 2026+: CAGR 5.00% projection.
| Year | Annual Salary | Status |
|---|---|---|
| 2021 | $402,129 | Actual |
| 2022 | $422,235 | Actual |
| 2023 | $443,347 | Actual |
| 2024 | $330,060 | Actual |
| 2025 | $488,790 | Actual |
| 2026(current) | $513,230 | Estimated |
| 2027 | $538,891 | Projected |
Based on 5 years of BLS OEWS data for the Montana metropolitan area, the median radiologist salary grew 21.6% from $402,129 (2021) to $488,790 (2025). At a 5.00% compound annual growth rate, salaries are projected to reach $538,891 by 2027 — a total increase of $136,762 (34.01%) from 2021.
Note: Historical values (2021–2025) are actual BLS OEWS figures for the Montana metropolitan area, sourced from annual Occupational Employment and Wage Statistics surveys. 2026–2026 figures are current estimates, and 2027 values are projections, calculated using a 5.00% CAGR derived from 5-year BLS historical data. Actual salaries may vary based on employer, experience, certifications, and local market conditions.
Top 5 Highest Paying Cities in Montana
Lowest Paying Cities in Montana
Best Value Cities for Radiologists in Montana
When adjusted for local cost of living, these Montana cities offer the most purchasing power for radiologists.
| City | Nominal Salary | CoL Index | Adjusted Salary |
|---|---|---|---|
| Billings | $532,140 | 96.2 | $553,160 |
| Great Falls | $514,695 | 96.2 | $535,026 |
| Bozeman | $507,828 | 96.2 | $527,888 |
| Missoula | $504,681 | 96.2 | $524,616 |
| Butte | $501,534 | 96.2 | $521,345 |
Adjusted salary = nominal salary × (100 / CoL index). CoL index: 100 = national average. Lower index = lower cost of living.
Salary by Experience Level in Montana
| Experience Level | Estimated Annual |
|---|---|
| Entry Level (0-2 years) | $297,673 |
| Mid Career (3-7 years) | $513,230 |
| Experienced (7+ years) | $726,029 |
Estimates based on BLS percentile data averaged across Montana metro areas. Individual pay varies by employer, certifications, and specialization.
All 7 Cities in Montana
More Montana Salary Data
Senior / Experienced
Top earner salaries for experienced radiologists.
Explore More Radiologist Salary Data
Frequently Asked Questions
How much do radiologists make in Montana in 2026?
What is the highest paying city for radiologists in Montana?
How does Montana radiologist pay compare to the national average?
What is the entry-level radiologist salary in Montana?
How many radiologists are employed in Montana?
Which Montana city offers the best value for radiologists?
Written by Dr. Maria Chen, MD
Career Analyst
Dr. Chen has 10 years of experience in diagnostic radiology. She specializes in imaging techniques for oncology. She works at a regional medical center.
Methodology & Data Source
Statewide salary figures on this page are 2026 projections based on the Bureau of Labor Statistics Occupational Employment and Wage Statistics (OEWS) survey, May 2026 release. A 5.00% compound annual growth rate (CAGR), derived from 6-year national BLS wage trends, was applied to each metro area's reported salary to estimate current 2026 radiologist compensation across Montana. State averages are employment-weighted across 7 metro areas — larger metro areas with more radiologistscontribute proportionally more to the average, producing figures that better reflect typical compensation. Individual pay varies by city, employer, certifications, and experience.
Data Sources & Methodology
Source: BLS, OEWS, 2-year dataset (–). Per-city data from annual BLS metropolitan area surveys.
2026 figures are projected from 2025 BLS data using a compound annual growth rate (CAGR) of 5.00%, derived from historical BLS wage trends for radiologists (SOC 29-1224).
Compiled and verified by Dr. Maria Chen, MD, a licensed radiologist with 10+ years of clinical experience. · View source data at BLS.gov