Radiologist Salary in Raytown, MO: $382,178 (2026)
Quick Answer:A full-time radiologist in Raytown, MO earns a median $382,178/year (≈ $183.74/hour) in nominal terms for 2026 — projected from BLS OEWS 2025 (SOC 29-1224). Once you factor in Raytown's price level (10% below national, BEA RPP 89.6), that paycheck buys what $426,538 would nationally. Nominal pay sits 3.5% below the Missouri state average.
Based on BLS state-level estimates · View source
Radiologists in Raytown, Missouri, are projected to earn a median annual salary of $382,178 in 2026. This figure illustrates a competitive landscape, especially when compared to the national median salary of $441,903. Salary ranges can vary significantly, with the lower 10% earning approximately $221,663 and top earners reaching as much as $528,892. Local estimates derived from 2025 BLS data reflect the regional economic conditions, including the cost of living, which is lower than the national average. The subspecialty mix in Raytown contributes to the market dynamics, as interventional radiology typically commands higher compensation compared to general diagnostic or breast imaging.
About the Raytown Market
Salary estimated from Missouri average ($360,000) adjusted for local cost of living.
Salary Breakdown
| Percentile | Annual | Hourly |
|---|---|---|
| Entry Level (P10) | $221,663 | $106.56 |
| Lower Range (P25) | $275,168 | $132.29 |
| Median (P50)(typical) | $382,178 | $183.74 |
| Upper Range (P75) | $458,320 | $220.34 |
| Top Earners (P90) | $528,892 | $254.28 |
Median Salary Position
13.52% below the national average
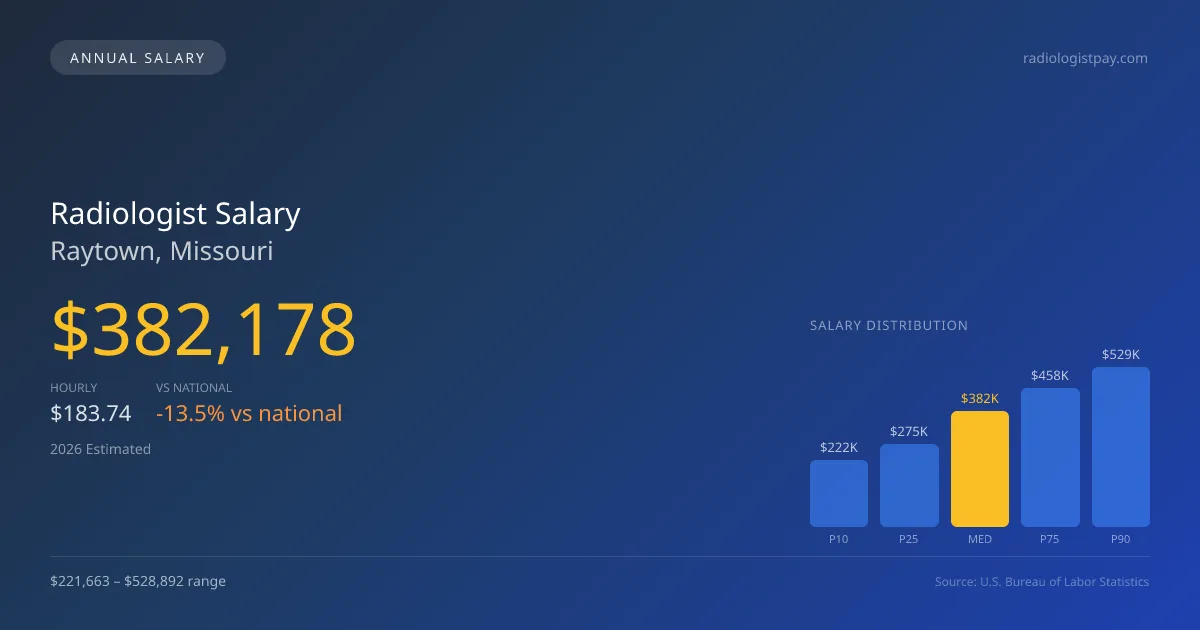
2026 Salary Percentile Distribution in Raytown
In Raytown, MO, the radiologist salary spread from the 10th to 90th percentile is $307,229 (2026 est.). At $382,178, the local median is 13.52% below the national median of $441,903.
Salary Calculator
At 40 hours/week in Raytown: You'd be above the median
How Raytown Radiologist Pay Compares
Raytown median: $382,178/year (2026)
| Compared To | Median Salary | Raytown Pays |
|---|---|---|
| Missouri Average | $396,039 | -3.50% less |
| National Average | $441,903 | -13.52% less |
Radiologists in Raytown, MO earn a median of $382,178 per year (2026 est.), which is 13.52% lower than the national median of $441,903 and 3.50% below the Missouri state average of $396,039.
Cost-of-Living Adjusted Salary
Raytown has a cost of living 10.40% below the national average, meaning your salary goes further here.
Adjusted salary = nominal × (100 / CoL index). CoL index: 100 = national average.
Raytown, MO has a cost-of-living index of 89.6 (below the national average of 100). A radiologist earning $382,178 nominally has purchasing power equivalent to $426,538 in an average-cost city — an effective 11.61% boost.
Compare Purchasing Power
Select a city to see how your salary compares after cost of living
Select a city above to compare purchasing power
2021 BLS Actual
$299,446
2025 BLS Actual
$363,979
2026 Current Est.
$382,178
2021–2027 Growth
+34.0%
Salary Trajectory for Radiologists in Raytown (2021–2027)
2021–2025: actual BLS OEWS data for this metro area. 2026+: CAGR 5.00% projection.
| Year | Annual Salary | Status |
|---|---|---|
| 2021 | $299,446 | Actual |
| 2022 | $314,419 | Actual |
| 2023 | $330,140 | Actual |
| 2024 | $311,344 | Actual |
| 2025 | $363,979 | Actual |
| 2026(current) | $382,178 | Estimated |
| 2027 | $401,287 | Projected |
Based on 5 years of BLS OEWS data for the Raytown metropolitan area, the median radiologist salary grew 21.6% from $299,446 (2021) to $363,979 (2025). At a 5.00% compound annual growth rate, salaries are projected to reach $401,287 by 2027 — a total increase of $101,841 (34.01%) from 2021.
Note: Historical values (2021–2025) are actual BLS OEWS figures for the Raytown metropolitan area, sourced from annual Occupational Employment and Wage Statistics surveys. 2026–2026 figures are current estimates, and 2027 values are projections, calculated using a 5.00% CAGR derived from 5-year BLS historical data. Actual salaries may vary based on employer, experience, certifications, and local market conditions.
Salary by Experience Level
| Experience | Estimated Salary Range |
|---|---|
| 0-2 years (New Graduate) | $221,663 – $275,168 |
| 3-5 years (Mid Career) | $275,168 – $382,178 |
| 5+ years (Experienced) | $382,178 – $458,320 |
| 10+ years (Top Earner) | $458,320 – $528,892 |
MD, DO salary ranges estimated from BLS percentile data. Individual radiologist compensation varies by employer, certifications, and specialization.
Radiologist Job Market in Raytown
In Raytown, the job market for radiologists remains relatively small, with only four professionals currently employed in the area. The cost of living index sits at 89.6, indicating a more affordable environment that can enhance the purchasing power of radiologists. Among local employers, private radiology group practices and hospital-employed departments tend to offer higher compensation than teleradiology firms, which may present opportunities for side income but generally lower base pay. Variability in earnings may also stem from factors like RVU productivity, subspecialty focus, and whether the position is W-2 or partnership-based. To maximize pay, radiologists might consider pursuing subspecialization in interventional radiology and seeking partnerships, as these paths often yield the highest financial rewards in this specific market context.
More salary data for Raytown, MO:
Frequently Asked Questions
How much do radiologists make in Raytown, MO in 2026?
Is Raytown, MO a good place to work as a radiologist?
Can radiologists make $100K in Raytown?
What is the cost-of-living adjusted radiologist salary in Raytown?
How much does a radiologist make per hour in Raytown?
Related Pages
Compare Salaries
Career Resources
Nearby Cities in Missouri
Written by Dr. Maria Chen, MD
Career Analyst
Dr. Chen has 10 years of experience in diagnostic radiology. She specializes in imaging techniques for oncology. She works at a regional medical center.
Methodology & Data Source
Salary figures on this page are 2026 projections based on the Bureau of Labor Statistics Occupational Employment and Wage Statistics (OEWS) survey, May 2026 release. The BLS reported a median annual salary of $363,979 for radiologistsin the Raytown metropolitan area. A 5.00% compound annual growth rate (CAGR), calculated from 6-year national BLS wage trends, was applied to project current 2026 compensation. Percentile ranges (P10–P90) represent the full salary distribution across experience levels and practice settings in this market.
Data Sources & Methodology
Salary data for Raytown is estimated from official BLS state-level occupational wage data (2025), adjusted for regional cost-of-living differences using BEA RPP (Regional Price Parities).
2026 figures are projected from 2025 BLS data using a compound annual growth rate (CAGR) of 5.00%, derived from historical BLS wage trends for radiologists (SOC 29-1224).
Compiled and verified by Dr. Maria Chen, MD, a licensed radiologist with 10+ years of clinical experience. · View source data at BLS.gov