Radiologist Salary in Raymore, MO: $366,547 (2026)
Quick Answer:A full-time radiologist in Raymore, MO earns a median $366,547/year (≈ $176.22/hour) in nominal terms for 2026 — projected from BLS OEWS 2025 (SOC 29-1224). Once you factor in Raymore's price level (10% below national, BEA RPP 89.6), that paycheck buys what $409,093 would nationally. Nominal pay sits 7.4% below the Missouri state average.
Based on BLS state-level estimates · View source
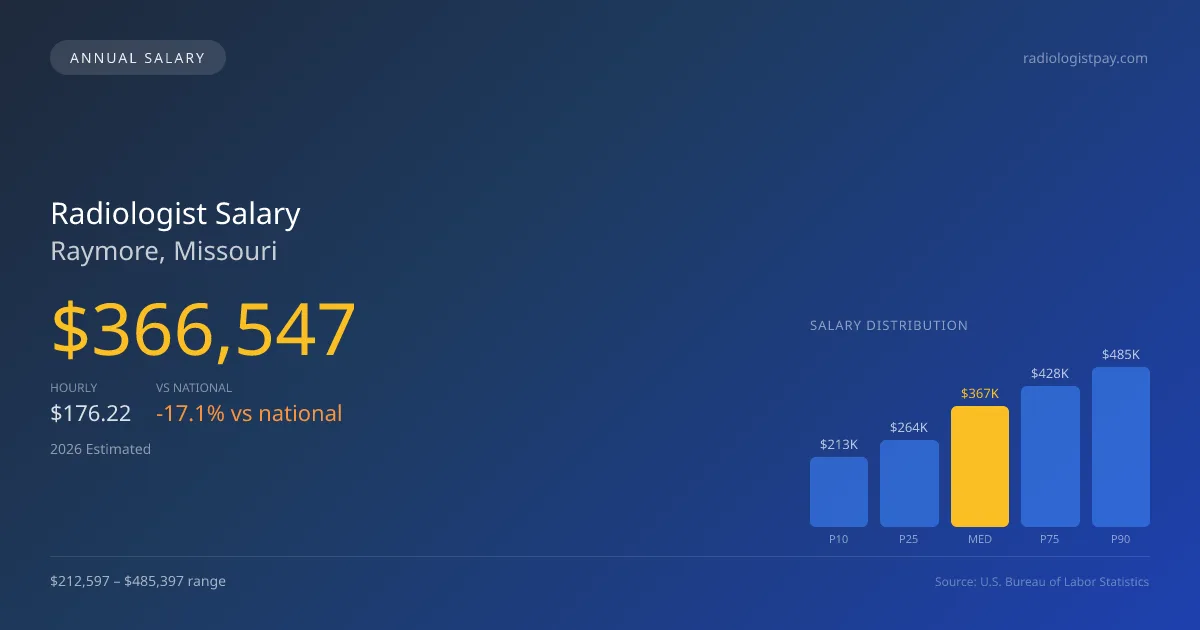
Radiologists in Raymore, Missouri, can expect a projected median annual salary of $366,547 in 2026, which trails the national median of $441,903 by approximately 17.05%. The salary range for this profession in the region spans from $212,597 at the 10th percentile to $485,397 at the 90th percentile. These figures, derived from 2025 BLS state-level data and adjusted for regional cost variations, illustrate a competitive local compensation landscape. With the rising prominence of teleradiology services, many radiologists in Raymore may enhance their income potential by engaging in supplemental night-hawk coverage or providing 24/7 services, effectively increasing their effective hourly compensation beyond traditional rates.
About the Raymore Market
Salary estimated from Missouri average ($360,000) adjusted for local cost of living.
Salary Breakdown
| Percentile | Annual | Hourly |
|---|---|---|
| Entry Level (P10) | $212,597 | $102.21 |
| Lower Range (P25) | $263,913 | $126.88 |
| Median (P50)(typical) | $366,547 | $176.22 |
| Upper Range (P75) | $428,084 | $205.81 |
| Top Earners (P90) | $485,397 | $233.36 |
Median Salary Position
17.05% below the national average
2026 Salary Percentile Distribution in Raymore
In Raymore, MO, the radiologist salary spread from the 10th to 90th percentile is $272,800 (2026 est.). At $366,547, the local median is 17.05% below the national median of $441,903.
Salary Calculator
At 40 hours/week in Raymore: You'd be above the median
How Raymore Radiologist Pay Compares
Raymore median: $366,547/year (2026)
| Compared To | Median Salary | Raymore Pays |
|---|---|---|
| Missouri Average | $395,839 | -7.40% less |
| National Average | $441,903 | -17.05% less |
Radiologists in Raymore, MO earn a median of $366,547 per year (2026 est.), which is 17.05% lower than the national median of $441,903 and 7.40% below the Missouri state average of $395,839.
Cost-of-Living Adjusted Salary
Raymore has a cost of living 10.40% below the national average, meaning your salary goes further here.
Adjusted salary = nominal × (100 / CoL index). CoL index: 100 = national average.
Raymore, MO has a cost-of-living index of 89.6 (below the national average of 100). A radiologist earning $366,547 nominally has purchasing power equivalent to $409,093 in an average-cost city — an effective 11.61% boost.
Compare Purchasing Power
Select a city to see how your salary compares after cost of living
Select a city above to compare purchasing power
2021 BLS Actual
$287,199
2025 BLS Actual
$349,092
2026 Current Est.
$366,547
2021–2027 Growth
+34.0%
Salary Trajectory for Radiologists in Raymore (2021–2027)
2021–2025: actual BLS OEWS data for this metro area. 2026+: CAGR 5.00% projection.
| Year | Annual Salary | Status |
|---|---|---|
| 2021 | $287,199 | Actual |
| 2022 | $301,559 | Actual |
| 2023 | $316,637 | Actual |
| 2024 | $298,610 | Actual |
| 2025 | $349,092 | Actual |
| 2026(current) | $366,547 | Estimated |
| 2027 | $384,874 | Projected |
Based on 5 years of BLS OEWS data for the Raymore metropolitan area, the median radiologist salary grew 21.6% from $287,199 (2021) to $349,092 (2025). At a 5.00% compound annual growth rate, salaries are projected to reach $384,874 by 2027 — a total increase of $97,675 (34.01%) from 2021.
Note: Historical values (2021–2025) are actual BLS OEWS figures for the Raymore metropolitan area, sourced from annual Occupational Employment and Wage Statistics surveys. 2026–2026 figures are current estimates, and 2027 values are projections, calculated using a 5.00% CAGR derived from 5-year BLS historical data. Actual salaries may vary based on employer, experience, certifications, and local market conditions.
Salary by Experience Level
| Experience | Estimated Salary Range |
|---|---|
| 0-2 years (New Graduate) | $212,597 – $263,913 |
| 3-5 years (Mid Career) | $263,913 – $366,547 |
| 5+ years (Experienced) | $366,547 – $428,084 |
| 10+ years (Top Earner) | $428,084 – $485,397 |
MD, DO salary ranges estimated from BLS percentile data. Individual radiologist compensation varies by employer, certifications, and specialization.
Radiologist Job Market in Raymore
With only six radiologists currently employed in the Raymore area, the job market appears to be relatively tight, indicating potential for growth. The cost-of-living index in Raymore is notably lower at 89.6, which could enhance the purchasing power of radiologists compared to higher-cost areas. Among local payers, private radiology practices often offer the highest salaries, while hospital-employed positions typically range lower. The variation in wages can largely be attributed to factors such as RVU productivity, subspecialization, equity stakes in partnerships, and the nature of call coverage. Radiologists aiming to maximize their pay in Raymore may consider entering lucrative subspecialties like interventional radiology, which often command premium salaries and greater partnership opportunities, while capitalizing on teleradiology night coverage to bolster their income.
More salary data for Raymore, MO:
Frequently Asked Questions
How much do radiologists make in Raymore, MO in 2026?
Is Raymore, MO a good place to work as a radiologist?
Can radiologists make $100K in Raymore?
What is the cost-of-living adjusted radiologist salary in Raymore?
How much does a radiologist make per hour in Raymore?
Related Pages
Compare Salaries
Career Resources
Nearby Cities in Missouri
Written by Dr. Maria Chen, MD
Career Analyst
Dr. Chen has 10 years of experience in diagnostic radiology. She specializes in imaging techniques for oncology. She works at a regional medical center.
Methodology & Data Source
Salary figures on this page are 2026 projections based on the Bureau of Labor Statistics Occupational Employment and Wage Statistics (OEWS) survey, May 2026 release. The BLS reported a median annual salary of $349,092 for radiologistsin the Raymore metropolitan area. A 5.00% compound annual growth rate (CAGR), calculated from 6-year national BLS wage trends, was applied to project current 2026 compensation. Percentile ranges (P10–P90) represent the full salary distribution across experience levels and practice settings in this market.
Data Sources & Methodology
Salary data for Raymore is estimated from official BLS state-level occupational wage data (2025), adjusted for regional cost-of-living differences using BEA RPP (Regional Price Parities).
2026 figures are projected from 2025 BLS data using a compound annual growth rate (CAGR) of 5.00%, derived from historical BLS wage trends for radiologists (SOC 29-1224).
Compiled and verified by Dr. Maria Chen, MD, a licensed radiologist with 10+ years of clinical experience. · View source data at BLS.gov