Radiologist Salary in Cape Girardeau, MO: $384,113 (2026)
Quick Answer:A full-time radiologist in Cape Girardeau, MO earns a median $384,113/year (≈ $184.67/hour) in nominal terms for 2026 — projected from BLS OEWS 2025 (SOC 29-1224). Once you factor in Cape Girardeau's price level (10% below national, BEA RPP 89.6), that paycheck buys what $428,698 would nationally. Nominal pay sits 3.0% below the Missouri state average.
Based on BLS state-level estimates · View source
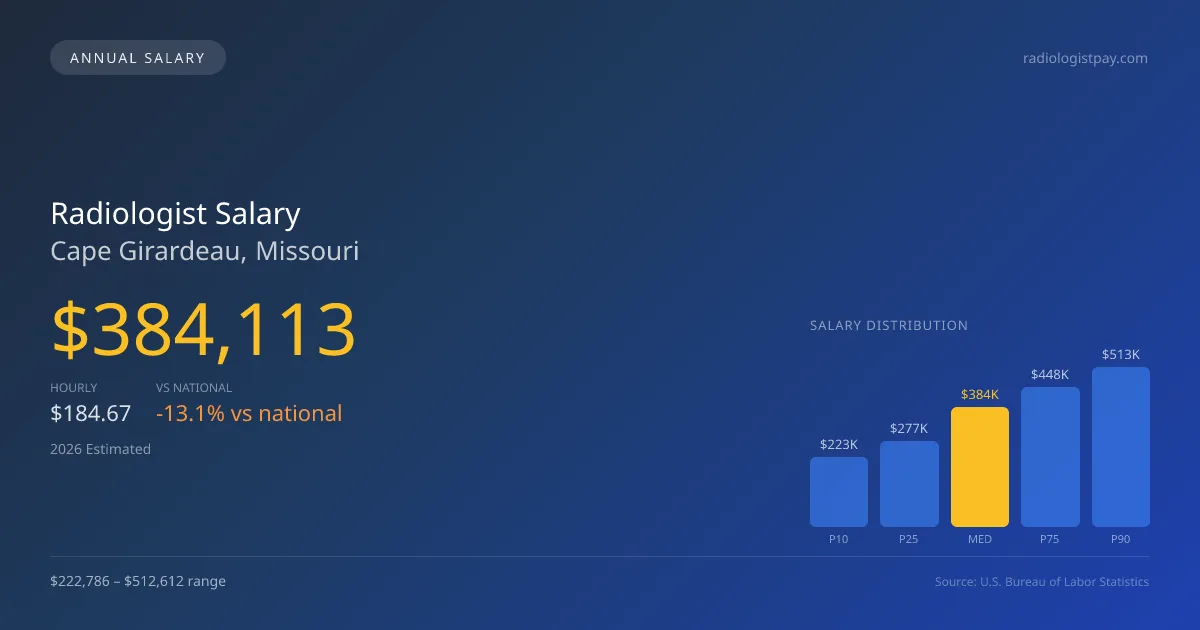
Radiologists in Cape Girardeau, Missouri can expect a median annual salary of $384,113 in 2026, reflecting the area's employment landscape and cost of living considerations. The projected salary range for this profession spans from $222,786 at the 10th percentile to $512,612 at the 90th percentile. With these figures derived from BLS state-level data, including regional price adjustments, the compensation for radiologists may benefit from opportunities in teleradiology. This secondary revenue source could effectively enhance hourly earnings, particularly for those working flexible hours or covering night shifts. Given the competitive nature of the healthcare market, these aspects can significantly affect a radiologist's overall compensation package in Cape Girardeau.
About the Cape Girardeau Market
Salary estimated from Missouri average ($360,000) adjusted for local cost of living.
Salary Breakdown
| Percentile | Annual | Hourly |
|---|---|---|
| Entry Level (P10) | $222,786 | $107.11 |
| Lower Range (P25) | $276,562 | $132.96 |
| Median (P50)(typical) | $384,113 | $184.67 |
| Upper Range (P75) | $448,220 | $215.49 |
| Top Earners (P90) | $512,612 | $246.45 |
Median Salary Position
13.08% below the national average
2026 Salary Percentile Distribution in Cape Girardeau
In Cape Girardeau, MO, the radiologist salary spread from the 10th to 90th percentile is $289,826 (2026 est.). At $384,113, the local median is 13.08% below the national median of $441,903.
Salary Calculator
At 40 hours/week in Cape Girardeau: You'd be above the median
How Cape Girardeau Radiologist Pay Compares
Cape Girardeau median: $384,113/year (2026)
| Compared To | Median Salary | Cape Girardeau Pays |
|---|---|---|
| Missouri Average | $395,993 | -3.00% less |
| National Average | $441,903 | -13.08% less |
Radiologists in Cape Girardeau, MO earn a median of $384,113 per year (2026 est.), which is 13.08% lower than the national median of $441,903 and 3.00% below the Missouri state average of $395,993.
Cost-of-Living Adjusted Salary
Cape Girardeau has a cost of living 10.40% below the national average, meaning your salary goes further here.
Adjusted salary = nominal × (100 / CoL index). CoL index: 100 = national average.
Cape Girardeau, MO has a cost-of-living index of 89.6 (below the national average of 100). A radiologist earning $384,113 nominally has purchasing power equivalent to $428,698 in an average-cost city — an effective 11.61% boost.
Compare Purchasing Power
Select a city to see how your salary compares after cost of living
Select a city above to compare purchasing power
2021 BLS Actual
$300,963
2025 BLS Actual
$365,822
2026 Current Est.
$384,113
2021–2027 Growth
+34.0%
Salary Trajectory for Radiologists in Cape Girardeau (2021–2027)
2021–2025: actual BLS OEWS data for this metro area. 2026+: CAGR 5.00% projection.
| Year | Annual Salary | Status |
|---|---|---|
| 2021 | $300,963 | Actual |
| 2022 | $316,011 | Actual |
| 2023 | $331,811 | Actual |
| 2024 | $312,921 | Actual |
| 2025 | $365,822 | Actual |
| 2026(current) | $384,113 | Estimated |
| 2027 | $403,319 | Projected |
Based on 5 years of BLS OEWS data for the Cape Girardeau metropolitan area, the median radiologist salary grew 21.6% from $300,963 (2021) to $365,822 (2025). At a 5.00% compound annual growth rate, salaries are projected to reach $403,319 by 2027 — a total increase of $102,356 (34.01%) from 2021.
Note: Historical values (2021–2025) are actual BLS OEWS figures for the Cape Girardeau metropolitan area, sourced from annual Occupational Employment and Wage Statistics surveys. 2026–2026 figures are current estimates, and 2027 values are projections, calculated using a 5.00% CAGR derived from 5-year BLS historical data. Actual salaries may vary based on employer, experience, certifications, and local market conditions.
Salary by Experience Level
| Experience | Estimated Salary Range |
|---|---|
| 0-2 years (New Graduate) | $222,786 – $276,562 |
| 3-5 years (Mid Career) | $276,562 – $384,113 |
| 5+ years (Experienced) | $384,113 – $448,220 |
| 10+ years (Top Earner) | $448,220 – $512,612 |
MD, DO salary ranges estimated from BLS percentile data. Individual radiologist compensation varies by employer, certifications, and specialization.
Radiologist Job Market in Cape Girardeau
In Cape Girardeau, the local job market currently employs six radiologists, which underscores a stable but small workforce that may lead to limited competition for positions. With a cost of living index at 89.6, living expenses are below the national average, influencing take-home pay and the overall purchasing power of radiologists in the area. Among the employers, private radiology groups often offer the highest salaries, especially for those who have an equity stake in partnerships, with income potential increased by productivity metrics like RVUs. Additionally, interventional radiology subspecialties can command significant premiums due to their in-demand skill sets, while roles with teleradiology firms can provide additional income through consistent call coverage. For radiologists in Cape Girardeau, focusing on productivity-driven practices and pursuing roles that offer partnership opportunities or additional call responsibilities will be key strategies for maximizing earnings in this unique market.
More salary data for Cape Girardeau, MO:
Frequently Asked Questions
How much do radiologists make in Cape Girardeau, MO in 2026?
Is Cape Girardeau, MO a good place to work as a radiologist?
Can radiologists make $100K in Cape Girardeau?
What is the cost-of-living adjusted radiologist salary in Cape Girardeau?
How much does a radiologist make per hour in Cape Girardeau?
Related Pages
Compare Salaries
Career Resources
Nearby Cities in Missouri
Written by Dr. Maria Chen, MD
Career Analyst
Dr. Chen has 10 years of experience in diagnostic radiology. She specializes in imaging techniques for oncology. She works at a regional medical center.
Methodology & Data Source
Salary figures on this page are 2026 projections based on the Bureau of Labor Statistics Occupational Employment and Wage Statistics (OEWS) survey, May 2026 release. The BLS reported a median annual salary of $365,822 for radiologistsin the Cape Girardeau metropolitan area. A 5.00% compound annual growth rate (CAGR), calculated from 6-year national BLS wage trends, was applied to project current 2026 compensation. Percentile ranges (P10–P90) represent the full salary distribution across experience levels and practice settings in this market.
Data Sources & Methodology
Salary data for Cape Girardeau is estimated from official BLS state-level occupational wage data (2025), adjusted for regional cost-of-living differences using BEA RPP (Regional Price Parities).
2026 figures are projected from 2025 BLS data using a compound annual growth rate (CAGR) of 5.00%, derived from historical BLS wage trends for radiologists (SOC 29-1224).
Compiled and verified by Dr. Maria Chen, MD, a licensed radiologist with 10+ years of clinical experience. · View source data at BLS.gov