Radiologist Salary in Branson, MO: $367,946 (2026)
Quick Answer:A full-time radiologist in Branson, MO earns a median $367,946/year (≈ $176.89/hour) in nominal terms for 2026 — projected from BLS OEWS 2025 (SOC 29-1224). Once you factor in Branson's price level (10% below national, BEA RPP 89.6), that paycheck buys what $410,654 would nationally. Nominal pay sits 7.1% below the Missouri state average.
Based on BLS state-level estimates · View source
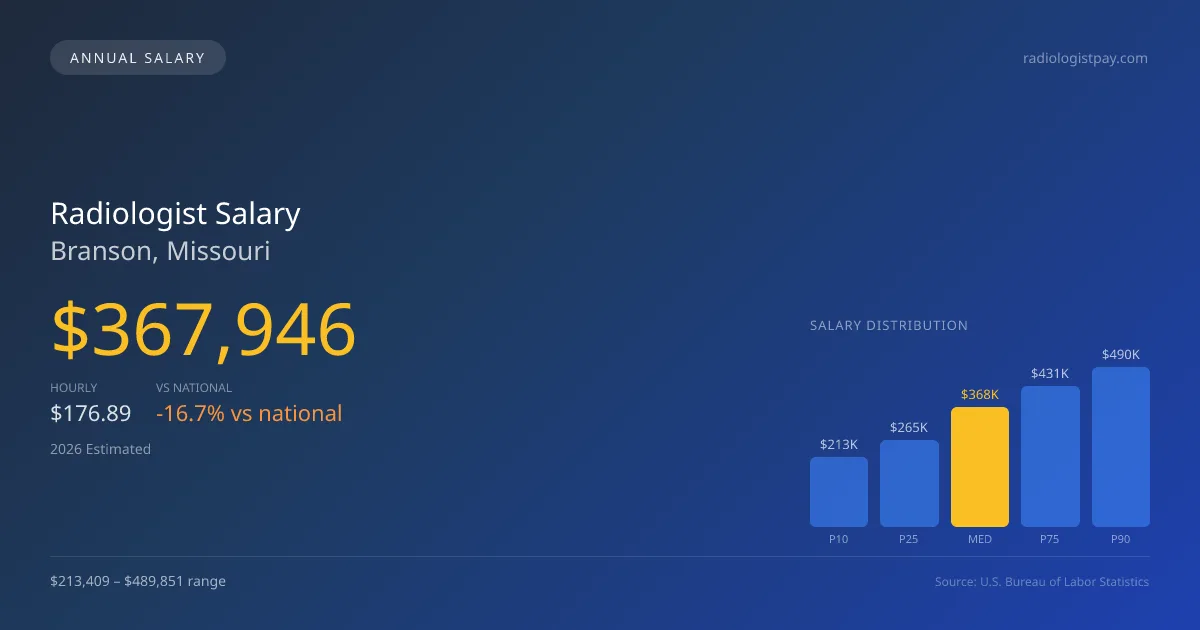
In Branson, Missouri, radiologists can expect to earn a median annual salary of $367,946 in 2026. This compensation clearly reflects a robust healthcare market, with a salary range spanning from $213,409 at the 10th percentile to $489,851 at the 90th percentile. Estimates derived from 2025 BLS data and regional price adjustments point to a competitive environment for radiologists, though the local median falls about 16.74% below the national average of $441,903. Factors such as the subspecialty mix— including interventional radiology (IR), general diagnostic radiology, and breast imaging—play a pivotal role in shaping salary structures, with interventional radiologists leading the pack in earning potential.
About the Branson Market
Salary estimated from Missouri average ($360,000) adjusted for local cost of living.
Salary Breakdown
| Percentile | Annual | Hourly |
|---|---|---|
| Entry Level (P10) | $213,409 | $102.60 |
| Lower Range (P25) | $264,921 | $127.37 |
| Median (P50)(typical) | $367,946 | $176.89 |
| Upper Range (P75) | $431,328 | $207.36 |
| Top Earners (P90) | $489,851 | $235.50 |
Median Salary Position
16.74% below the national average
2026 Salary Percentile Distribution in Branson
In Branson, MO, the radiologist salary spread from the 10th to 90th percentile is $276,442 (2026 est.). At $367,946, the local median is 16.74% below the national median of $441,903.
Salary Calculator
At 40 hours/week in Branson: You'd be above the median
How Branson Radiologist Pay Compares
Branson median: $367,946/year (2026)
| Compared To | Median Salary | Branson Pays |
|---|---|---|
| Missouri Average | $396,067 | -7.10% less |
| National Average | $441,903 | -16.74% less |
Radiologists in Branson, MO earn a median of $367,946 per year (2026 est.), which is 16.74% lower than the national median of $441,903 and 7.10% below the Missouri state average of $396,067.
Cost-of-Living Adjusted Salary
Branson has a cost of living 10.40% below the national average, meaning your salary goes further here.
Adjusted salary = nominal × (100 / CoL index). CoL index: 100 = national average.
Branson, MO has a cost-of-living index of 89.6 (below the national average of 100). A radiologist earning $367,946 nominally has purchasing power equivalent to $410,654 in an average-cost city — an effective 11.61% boost.
Compare Purchasing Power
Select a city to see how your salary compares after cost of living
Select a city above to compare purchasing power
2021 BLS Actual
$288,296
2025 BLS Actual
$350,425
2026 Current Est.
$367,946
2021–2027 Growth
+34.0%
Salary Trajectory for Radiologists in Branson (2021–2027)
2021–2025: actual BLS OEWS data for this metro area. 2026+: CAGR 5.00% projection.
| Year | Annual Salary | Status |
|---|---|---|
| 2021 | $288,296 | Actual |
| 2022 | $302,710 | Actual |
| 2023 | $317,846 | Actual |
| 2024 | $299,750 | Actual |
| 2025 | $350,425 | Actual |
| 2026(current) | $367,946 | Estimated |
| 2027 | $386,344 | Projected |
Based on 5 years of BLS OEWS data for the Branson metropolitan area, the median radiologist salary grew 21.6% from $288,296 (2021) to $350,425 (2025). At a 5.00% compound annual growth rate, salaries are projected to reach $386,344 by 2027 — a total increase of $98,048 (34.01%) from 2021.
Note: Historical values (2021–2025) are actual BLS OEWS figures for the Branson metropolitan area, sourced from annual Occupational Employment and Wage Statistics surveys. 2026–2026 figures are current estimates, and 2027 values are projections, calculated using a 5.00% CAGR derived from 5-year BLS historical data. Actual salaries may vary based on employer, experience, certifications, and local market conditions.
Salary by Experience Level
| Experience | Estimated Salary Range |
|---|---|
| 0-2 years (New Graduate) | $213,409 – $264,921 |
| 3-5 years (Mid Career) | $264,921 – $367,946 |
| 5+ years (Experienced) | $367,946 – $431,328 |
| 10+ years (Top Earner) | $431,328 – $489,851 |
MD, DO salary ranges estimated from BLS percentile data. Individual radiologist compensation varies by employer, certifications, and specialization.
Radiologist Job Market in Branson
The job market for radiologists in Branson is relatively small, with only four employed practitioners, which suggests limited competition but also possible constraints on job openings. The cost of living index at 89.6 indicates that healthcare professionals in Branson enjoy a more favorable purchasing power compared to many other regions. Among the available employers, private radiology group practices and hospital departments typically offer the highest salaries; however, subspecialties like IR can lead to significant pay premiums due to their heightened complexity and demand. Variability in pay is often driven by factors such as RVU productivity models, call coverage responsibilities, and the choice between W-2 versus partnership roles. For radiologists looking to maximize their pay in this market, it’s advisable to focus on enhancing productivity and considering partnerships that may provide equity stakes and additional revenue opportunities from teleradiology.
More salary data for Branson, MO:
Frequently Asked Questions
How much do radiologists make in Branson, MO in 2026?
Is Branson, MO a good place to work as a radiologist?
Can radiologists make $100K in Branson?
What is the cost-of-living adjusted radiologist salary in Branson?
How much does a radiologist make per hour in Branson?
Related Pages
Compare Salaries
Career Resources
Nearby Cities in Missouri
Written by Dr. Maria Chen, MD
Career Analyst
Dr. Chen has 10 years of experience in diagnostic radiology. She specializes in imaging techniques for oncology. She works at a regional medical center.
Methodology & Data Source
Salary figures on this page are 2026 projections based on the Bureau of Labor Statistics Occupational Employment and Wage Statistics (OEWS) survey, May 2026 release. The BLS reported a median annual salary of $350,425 for radiologistsin the Branson metropolitan area. A 5.00% compound annual growth rate (CAGR), calculated from 6-year national BLS wage trends, was applied to project current 2026 compensation. Percentile ranges (P10–P90) represent the full salary distribution across experience levels and practice settings in this market.
Data Sources & Methodology
Salary data for Branson is estimated from official BLS state-level occupational wage data (2025), adjusted for regional cost-of-living differences using BEA RPP (Regional Price Parities).
2026 figures are projected from 2025 BLS data using a compound annual growth rate (CAGR) of 5.00%, derived from historical BLS wage trends for radiologists (SOC 29-1224).
Compiled and verified by Dr. Maria Chen, MD, a licensed radiologist with 10+ years of clinical experience. · View source data at BLS.gov