Radiologist Salary in Ridgeland, MS: $398,712 (2026)
Quick Answer:A full-time radiologist in Ridgeland, MS earns a median $398,712/year (≈ $191.69/hour) in nominal terms for 2026 — projected from BLS OEWS 2025 (SOC 29-1224). Once you factor in Ridgeland's price level (14% below national, BEA RPP 85.7), that paycheck buys what $465,242 would nationally. Nominal pay sits 4.0% below the Mississippi state average.
Based on BLS state-level estimates · View source
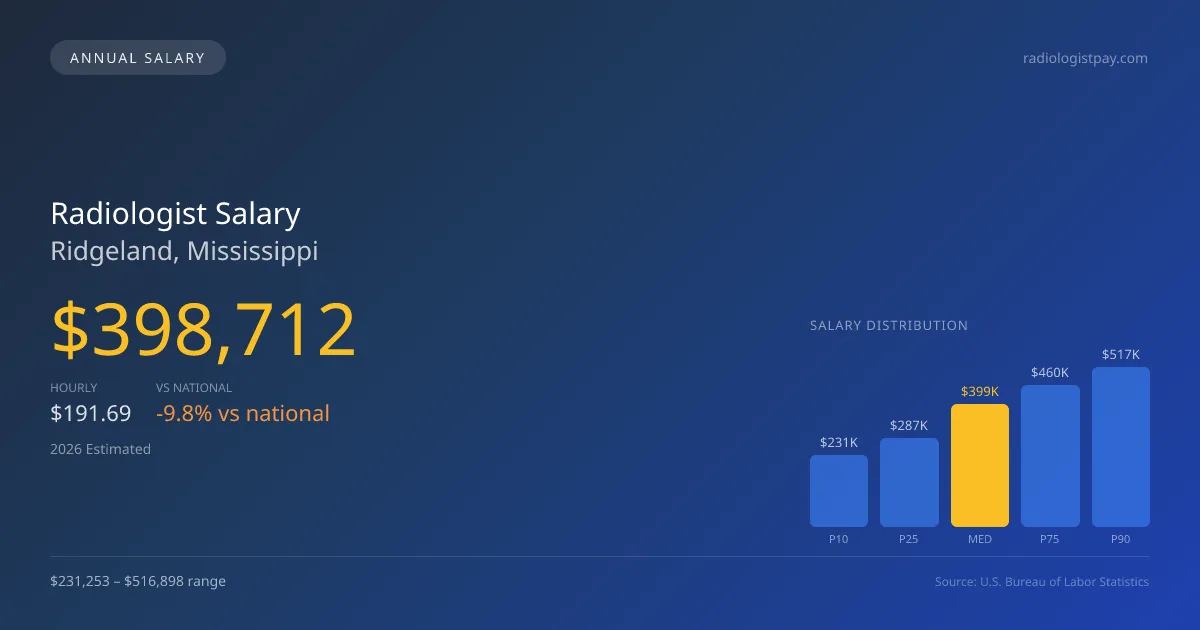
With a projected median annual salary of $398,712 in 2026, radiologists in Ridgeland, Mississippi, experience competitive pay compared to the national median, which stands at $441,903. The salary range for this profession in Ridgeland varies significantly, with the lowest earners making approximately $231,253 and the top 10% earning up to $516,898, reflecting both local market conditions and the influence of teleradiology work that boosts effective hourly compensation. These estimates are based on 2025 BLS state-level data with regional price parities, shedding light on the salaries amidst a market where opportunities to advance earnings through side income are prevalent.
About the Ridgeland Market
Salary estimated from Mississippi average ($320,000) adjusted for local cost of living.
Salary Breakdown
| Percentile | Annual | Hourly |
|---|---|---|
| Entry Level (P10) | $231,253 | $111.18 |
| Lower Range (P25) | $287,073 | $138.01 |
| Median (P50)(typical) | $398,712 | $191.69 |
| Upper Range (P75) | $459,674 | $220.99 |
| Top Earners (P90) | $516,898 | $248.51 |
Median Salary Position
9.77% below the national average
2026 Salary Percentile Distribution in Ridgeland
In Ridgeland, MS, the radiologist salary spread from the 10th to 90th percentile is $285,645 (2026 est.). At $398,712, the local median is 9.77% below the national median of $441,903.
Salary Calculator
At 40 hours/week in Ridgeland: You'd be above the median
How Ridgeland Radiologist Pay Compares
Ridgeland median: $398,712/year (2026)
| Compared To | Median Salary | Ridgeland Pays |
|---|---|---|
| Mississippi Average | $415,325 | -4.00% less |
| National Average | $441,903 | -9.77% less |
Radiologists in Ridgeland, MS earn a median of $398,712 per year (2026 est.), which is 9.77% lower than the national median of $441,903 and 4.00% below the Mississippi state average of $415,325.
Cost-of-Living Adjusted Salary
Ridgeland has a cost of living 14.30% below the national average, meaning your salary goes further here.
Adjusted salary = nominal × (100 / CoL index). CoL index: 100 = national average.
Ridgeland, MS has a cost-of-living index of 85.7 (below the national average of 100). A radiologist earning $398,712 nominally has purchasing power equivalent to $465,242 in an average-cost city — an effective 16.69% boost.
Compare Purchasing Power
Select a city to see how your salary compares after cost of living
Select a city above to compare purchasing power
2021 BLS Actual
$312,402
2025 BLS Actual
$379,726
2026 Current Est.
$398,712
2021–2027 Growth
+34.0%
Salary Trajectory for Radiologists in Ridgeland (2021–2027)
2021–2025: actual BLS OEWS data for this metro area. 2026+: CAGR 5.00% projection.
| Year | Annual Salary | Status |
|---|---|---|
| 2021 | $312,402 | Actual |
| 2022 | $328,022 | Actual |
| 2023 | $344,423 | Actual |
| 2024 | $263,302 | Actual |
| 2025 | $379,726 | Actual |
| 2026(current) | $398,712 | Estimated |
| 2027 | $418,648 | Projected |
Based on 5 years of BLS OEWS data for the Ridgeland metropolitan area, the median radiologist salary grew 21.6% from $312,402 (2021) to $379,726 (2025). At a 5.00% compound annual growth rate, salaries are projected to reach $418,648 by 2027 — a total increase of $106,246 (34.01%) from 2021.
Note: Historical values (2021–2025) are actual BLS OEWS figures for the Ridgeland metropolitan area, sourced from annual Occupational Employment and Wage Statistics surveys. 2026–2026 figures are current estimates, and 2027 values are projections, calculated using a 5.00% CAGR derived from 5-year BLS historical data. Actual salaries may vary based on employer, experience, certifications, and local market conditions.
Salary by Experience Level
| Experience | Estimated Salary Range |
|---|---|
| 0-2 years (New Graduate) | $231,253 – $287,073 |
| 3-5 years (Mid Career) | $287,073 – $398,712 |
| 5+ years (Experienced) | $398,712 – $459,674 |
| 10+ years (Top Earner) | $459,674 – $516,898 |
MD, DO salary ranges estimated from BLS percentile data. Individual radiologist compensation varies by employer, certifications, and specialization.
Radiologist Job Market in Ridgeland
The job market in Ridgeland is relatively tight, with only five radiologists currently employed in the area, which influences overall compensation dynamics. Coupled with a cost of living index of 85.7, radiologists in Ridgeland find their take-home pay to stretch further than in many urban areas. Employers in the region, particularly private radiology groups, may offer more appealing compensation packages, especially when they include partnership opportunities which can significantly drive earnings from subspecialties, such as interventional radiology, known for high productivity and increased pay. To effectively maximize radiologist pay in Ridgeland MS, professionals should consider specializing in high-demand areas, negotiating partnership stakes, and pursuing teleradiology roles, especially for night and weekend shifts, which can enhance both salary and overall work-life balance.
More salary data for Ridgeland, MS:
Frequently Asked Questions
How much do radiologists make in Ridgeland, MS in 2026?
Is Ridgeland, MS a good place to work as a radiologist?
Can radiologists make $100K in Ridgeland?
What is the cost-of-living adjusted radiologist salary in Ridgeland?
How much does a radiologist make per hour in Ridgeland?
Related Pages
Compare Salaries
Career Resources
Nearby Cities in Mississippi
Written by Dr. Maria Chen, MD
Career Analyst
Dr. Chen has 10 years of experience in diagnostic radiology. She specializes in imaging techniques for oncology. She works at a regional medical center.
Methodology & Data Source
Salary figures on this page are 2026 projections based on the Bureau of Labor Statistics Occupational Employment and Wage Statistics (OEWS) survey, May 2026 release. The BLS reported a median annual salary of $379,726 for radiologistsin the Ridgeland metropolitan area. A 5.00% compound annual growth rate (CAGR), calculated from 6-year national BLS wage trends, was applied to project current 2026 compensation. Percentile ranges (P10–P90) represent the full salary distribution across experience levels and practice settings in this market.
Data Sources & Methodology
Salary data for Ridgeland is estimated from official BLS state-level occupational wage data (2025), adjusted for regional cost-of-living differences using BEA RPP (Regional Price Parities).
2026 figures are projected from 2025 BLS data using a compound annual growth rate (CAGR) of 5.00%, derived from historical BLS wage trends for radiologists (SOC 29-1224).
Compiled and verified by Dr. Maria Chen, MD, a licensed radiologist with 10+ years of clinical experience. · View source data at BLS.gov