Radiologist Salary in Oxford, MS: $396,194 (2026)
Quick Answer:A full-time radiologist in Oxford, MS earns a median $396,194/year (≈ $190.48/hour) in nominal terms for 2026 — projected from BLS OEWS 2025 (SOC 29-1224). Once you factor in Oxford's price level (14% below national, BEA RPP 85.7), that paycheck buys what $462,303 would nationally. Nominal pay sits 4.6% below the Mississippi state average.
Based on BLS state-level estimates · View source
In 2026, the median salary for radiologists in Oxford, Mississippi, is projected to be $396,194, notably lower than the national median of $441,903. The salary range for radiologists in this area spans from $229,793 at the 10th percentile to $539,434 at the 90th percentile, reflecting a competitive but regional pay structure influenced by subspecialty demands. The market features a mix of general diagnostic radiologists, interventional radiologists, and breast imaging specialists. With estimates derived from BLS state-level data and adjusted for regional price parities, the opportunities for radiologists in Oxford indicate a market fueled by local healthcare needs and varying service offerings, suggesting that those specializing in interventional radiology may command higher salaries within this context.
About the Oxford Market
Salary estimated from Mississippi average ($320,000) adjusted for local cost of living.
Salary Breakdown
| Percentile | Annual | Hourly |
|---|---|---|
| Entry Level (P10) | $229,793 | $110.48 |
| Lower Range (P25) | $285,260 | $137.14 |
| Median (P50)(typical) | $396,194 | $190.48 |
| Upper Range (P75) | $478,276 | $229.94 |
| Top Earners (P90) | $539,434 | $259.34 |
Median Salary Position
10.34% below the national average
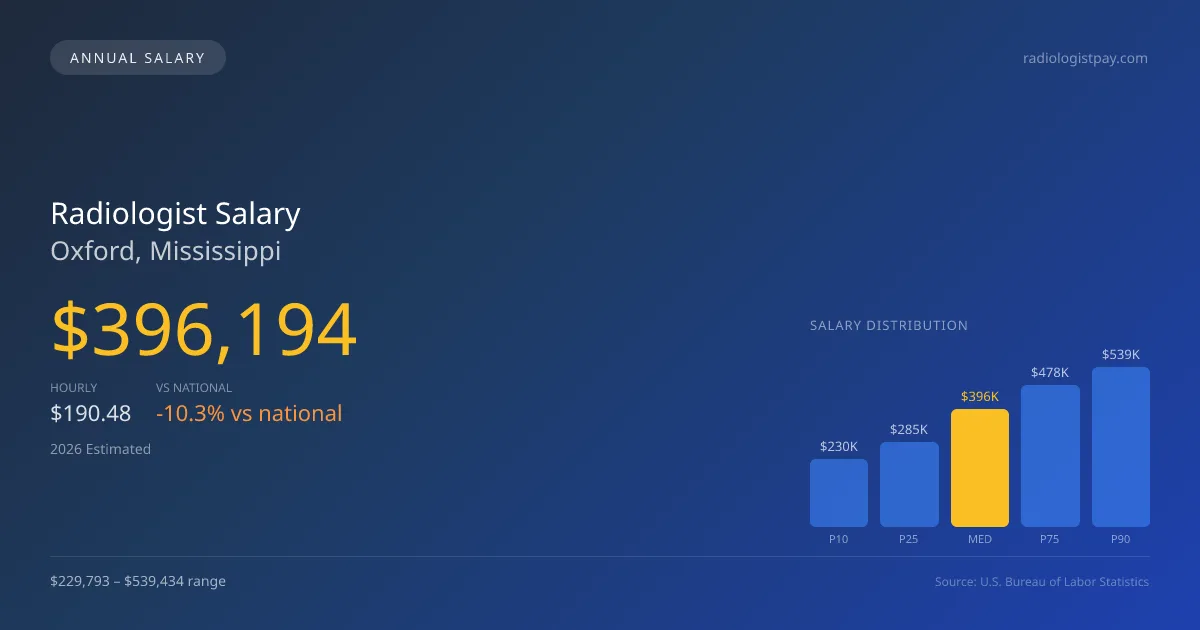
2026 Salary Percentile Distribution in Oxford
In Oxford, MS, the radiologist salary spread from the 10th to 90th percentile is $309,641 (2026 est.). At $396,194, the local median is 10.34% below the national median of $441,903.
Salary Calculator
At 40 hours/week in Oxford: You'd be above the median
How Oxford Radiologist Pay Compares
Oxford median: $396,194/year (2026)
| Compared To | Median Salary | Oxford Pays |
|---|---|---|
| Mississippi Average | $415,298 | -4.60% less |
| National Average | $441,903 | -10.34% less |
Radiologists in Oxford, MS earn a median of $396,194 per year (2026 est.), which is 10.34% lower than the national median of $441,903 and 4.60% below the Mississippi state average of $415,298.
Cost-of-Living Adjusted Salary
Oxford has a cost of living 14.30% below the national average, meaning your salary goes further here.
Adjusted salary = nominal × (100 / CoL index). CoL index: 100 = national average.
Oxford, MS has a cost-of-living index of 85.7 (below the national average of 100). A radiologist earning $396,194 nominally has purchasing power equivalent to $462,303 in an average-cost city — an effective 16.69% boost.
Compare Purchasing Power
Select a city to see how your salary compares after cost of living
Select a city above to compare purchasing power
2021 BLS Actual
$310,429
2025 BLS Actual
$377,328
2026 Current Est.
$396,194
2021–2027 Growth
+34.0%
Salary Trajectory for Radiologists in Oxford (2021–2027)
2021–2025: actual BLS OEWS data for this metro area. 2026+: CAGR 5.00% projection.
| Year | Annual Salary | Status |
|---|---|---|
| 2021 | $310,429 | Actual |
| 2022 | $325,950 | Actual |
| 2023 | $342,248 | Actual |
| 2024 | $261,640 | Actual |
| 2025 | $377,328 | Actual |
| 2026(current) | $396,194 | Estimated |
| 2027 | $416,004 | Projected |
Based on 5 years of BLS OEWS data for the Oxford metropolitan area, the median radiologist salary grew 21.6% from $310,429 (2021) to $377,328 (2025). At a 5.00% compound annual growth rate, salaries are projected to reach $416,004 by 2027 — a total increase of $105,575 (34.01%) from 2021.
Note: Historical values (2021–2025) are actual BLS OEWS figures for the Oxford metropolitan area, sourced from annual Occupational Employment and Wage Statistics surveys. 2026–2026 figures are current estimates, and 2027 values are projections, calculated using a 5.00% CAGR derived from 5-year BLS historical data. Actual salaries may vary based on employer, experience, certifications, and local market conditions.
Salary by Experience Level
| Experience | Estimated Salary Range |
|---|---|
| 0-2 years (New Graduate) | $229,793 – $285,260 |
| 3-5 years (Mid Career) | $285,260 – $396,194 |
| 5+ years (Experienced) | $396,194 – $478,276 |
| 10+ years (Top Earner) | $478,276 – $539,434 |
MD, DO salary ranges estimated from BLS percentile data. Individual radiologist compensation varies by employer, certifications, and specialization.
Radiologist Job Market in Oxford
Focusing on the local job market, there are currently five radiologists employed in the Oxford area, a relatively small cohort that influences the overall compensation landscape. The cost of living index stands at 85.7, making the purchasing power for radiologists somewhat more favorable compared to many national averages. Key employers include hospital-employed radiology departments and private radiology group practices, with the former typically offering stable W-2 positions while the latter often provide partnership opportunities that can significantly boost pay through equity stakes. The disparity between lower and higher salaries in Oxford derives from several factors, including RVU productivity, the subspecialty mix, and the opportunities for side income through teleradiology or weekend/night coverage. Radiologists seeking to maximize their earnings should consider targeting subspecialties like interventional radiology or exploring private partnership avenues, both of which tend to yield higher compensation compared to more traditional roles.
More salary data for Oxford, MS:
Frequently Asked Questions
How much do radiologists make in Oxford, MS in 2026?
Is Oxford, MS a good place to work as a radiologist?
Can radiologists make $100K in Oxford?
What is the cost-of-living adjusted radiologist salary in Oxford?
How much does a radiologist make per hour in Oxford?
Related Pages
Compare Salaries
Career Resources
Nearby Cities in Mississippi
Written by Dr. Maria Chen, MD
Career Analyst
Dr. Chen has 10 years of experience in diagnostic radiology. She specializes in imaging techniques for oncology. She works at a regional medical center.
Methodology & Data Source
Salary figures on this page are 2026 projections based on the Bureau of Labor Statistics Occupational Employment and Wage Statistics (OEWS) survey, May 2026 release. The BLS reported a median annual salary of $377,328 for radiologistsin the Oxford metropolitan area. A 5.00% compound annual growth rate (CAGR), calculated from 6-year national BLS wage trends, was applied to project current 2026 compensation. Percentile ranges (P10–P90) represent the full salary distribution across experience levels and practice settings in this market.
Data Sources & Methodology
Salary data for Oxford is estimated from official BLS state-level occupational wage data (2025), adjusted for regional cost-of-living differences using BEA RPP (Regional Price Parities).
2026 figures are projected from 2025 BLS data using a compound annual growth rate (CAGR) of 5.00%, derived from historical BLS wage trends for radiologists (SOC 29-1224).
Compiled and verified by Dr. Maria Chen, MD, a licensed radiologist with 10+ years of clinical experience. · View source data at BLS.gov