Radiologist Salary in Olive Branch, MS: $392,908 (2026)
Quick Answer:A full-time radiologist in Olive Branch, MS earns a median $392,908/year (≈ $188.90/hour) in nominal terms for 2026 — projected from BLS OEWS 2025 (SOC 29-1224). Once you factor in Olive Branch's price level (14% below national, BEA RPP 85.7), that paycheck buys what $458,469 would nationally. Nominal pay sits 5.4% below the Mississippi state average.
Based on BLS state-level estimates · View source
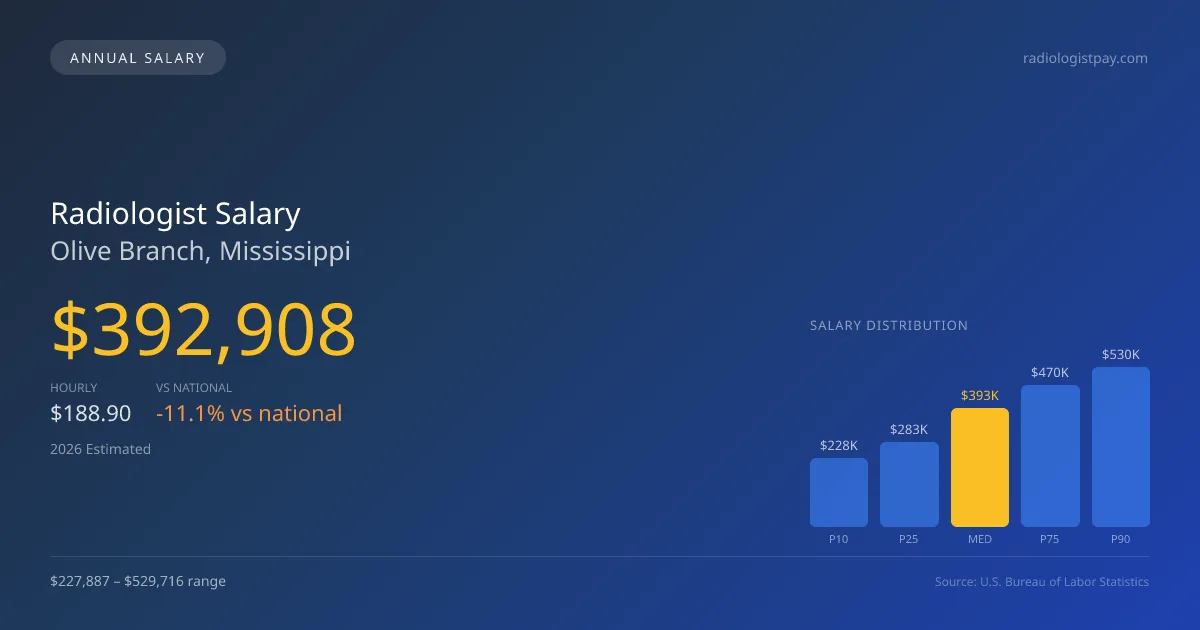
Radiologists in Olive Branch, Mississippi, can expect a 2026 median annual salary of $392,908, which is notably lower than the national median of $441,903. The salary range for this profession locally extends from $227,887 at the 10th percentile to $529,716 at the 90th percentile, reflecting diverse earning potentials based on experience, subspecialty, and employment type. These figures are derived from 2025 BLS data, adjusted to account for regional cost-of-living variations. In a market influenced significantly by teleradiology, many radiologists augment their incomes through side work, which effectively boosts their hourly compensation, thereby creating varied financial outcomes within an evolving job landscape in Olive Branch.
About the Olive Branch Market
Salary estimated from Mississippi average ($320,000) adjusted for local cost of living.
Salary Breakdown
| Percentile | Annual | Hourly |
|---|---|---|
| Entry Level (P10) | $227,887 | $109.56 |
| Lower Range (P25) | $282,894 | $136.01 |
| Median (P50)(typical) | $392,908 | $188.90 |
| Upper Range (P75) | $470,222 | $226.07 |
| Top Earners (P90) | $529,716 | $254.67 |
Median Salary Position
11.09% below the national average
2026 Salary Percentile Distribution in Olive Branch
In Olive Branch, MS, the radiologist salary spread from the 10th to 90th percentile is $301,829 (2026 est.). At $392,908, the local median is 11.09% below the national median of $441,903.
Salary Calculator
At 40 hours/week in Olive Branch: You'd be above the median
How Olive Branch Radiologist Pay Compares
Olive Branch median: $392,908/year (2026)
| Compared To | Median Salary | Olive Branch Pays |
|---|---|---|
| Mississippi Average | $415,336 | -5.40% less |
| National Average | $441,903 | -11.09% less |
Radiologists in Olive Branch, MS earn a median of $392,908 per year (2026 est.), which is 11.09% lower than the national median of $441,903 and 5.40% below the Mississippi state average of $415,336.
Cost-of-Living Adjusted Salary
Olive Branch has a cost of living 14.30% below the national average, meaning your salary goes further here.
Adjusted salary = nominal × (100 / CoL index). CoL index: 100 = national average.
Olive Branch, MS has a cost-of-living index of 85.7 (below the national average of 100). A radiologist earning $392,908 nominally has purchasing power equivalent to $458,469 in an average-cost city — an effective 16.69% boost.
Compare Purchasing Power
Select a city to see how your salary compares after cost of living
Select a city above to compare purchasing power
2021 BLS Actual
$307,854
2025 BLS Actual
$374,198
2026 Current Est.
$392,908
2021–2027 Growth
+34.0%
Salary Trajectory for Radiologists in Olive Branch (2021–2027)
2021–2025: actual BLS OEWS data for this metro area. 2026+: CAGR 5.00% projection.
| Year | Annual Salary | Status |
|---|---|---|
| 2021 | $307,854 | Actual |
| 2022 | $323,246 | Actual |
| 2023 | $339,409 | Actual |
| 2024 | $259,469 | Actual |
| 2025 | $374,198 | Actual |
| 2026(current) | $392,908 | Estimated |
| 2027 | $412,553 | Projected |
Based on 5 years of BLS OEWS data for the Olive Branch metropolitan area, the median radiologist salary grew 21.6% from $307,854 (2021) to $374,198 (2025). At a 5.00% compound annual growth rate, salaries are projected to reach $412,553 by 2027 — a total increase of $104,699 (34.01%) from 2021.
Note: Historical values (2021–2025) are actual BLS OEWS figures for the Olive Branch metropolitan area, sourced from annual Occupational Employment and Wage Statistics surveys. 2026–2026 figures are current estimates, and 2027 values are projections, calculated using a 5.00% CAGR derived from 5-year BLS historical data. Actual salaries may vary based on employer, experience, certifications, and local market conditions.
Salary by Experience Level
| Experience | Estimated Salary Range |
|---|---|
| 0-2 years (New Graduate) | $227,887 – $282,894 |
| 3-5 years (Mid Career) | $282,894 – $392,908 |
| 5+ years (Experienced) | $392,908 – $470,222 |
| 10+ years (Top Earner) | $470,222 – $529,716 |
MD, DO salary ranges estimated from BLS percentile data. Individual radiologist compensation varies by employer, certifications, and specialization.
Radiologist Job Market in Olive Branch
In Olive Branch, the local job market has a modest number of employed radiologists, currently totaling seven. The cost-of-living index stands at 85.7, indicating that while salaries may appear lower than the national average, the purchasing power of those earnings is relatively strong. The highest compensation typically comes from private radiology group practices and teleradiology firms, particularly for those willing to take on night coverage or flexible partnerships. Factors such as RVU productivity, subspecialty selection—particularly Interventional Radiology—and the choice between partnership equity and W-2 employment significantly influence pay disparities. For radiologists aiming to maximize their earnings in Olive Branch, focusing on lucrative subspecialties and considering teleradiology opportunities can be effective strategies to enhance overall compensation.
More salary data for Olive Branch, MS:
Frequently Asked Questions
How much do radiologists make in Olive Branch, MS in 2026?
Is Olive Branch, MS a good place to work as a radiologist?
Can radiologists make $100K in Olive Branch?
What is the cost-of-living adjusted radiologist salary in Olive Branch?
How much does a radiologist make per hour in Olive Branch?
Related Pages
Compare Salaries
Career Resources
Nearby Cities in Mississippi
Written by Dr. Maria Chen, MD
Career Analyst
Dr. Chen has 10 years of experience in diagnostic radiology. She specializes in imaging techniques for oncology. She works at a regional medical center.
Methodology & Data Source
Salary figures on this page are 2026 projections based on the Bureau of Labor Statistics Occupational Employment and Wage Statistics (OEWS) survey, May 2026 release. The BLS reported a median annual salary of $374,198 for radiologistsin the Olive Branch metropolitan area. A 5.00% compound annual growth rate (CAGR), calculated from 6-year national BLS wage trends, was applied to project current 2026 compensation. Percentile ranges (P10–P90) represent the full salary distribution across experience levels and practice settings in this market.
Data Sources & Methodology
Salary data for Olive Branch is estimated from official BLS state-level occupational wage data (2025), adjusted for regional cost-of-living differences using BEA RPP (Regional Price Parities).
2026 figures are projected from 2025 BLS data using a compound annual growth rate (CAGR) of 5.00%, derived from historical BLS wage trends for radiologists (SOC 29-1224).
Compiled and verified by Dr. Maria Chen, MD, a licensed radiologist with 10+ years of clinical experience. · View source data at BLS.gov