Radiologist Salary in Quincy, MA: $475,678 (2026)
Quick Answer:A full-time radiologist in Quincy, MA earns a median $475,678/year (≈ $228.69/hour) in nominal terms for 2026 — projected from BLS OEWS 2025 (SOC 29-1224). Once you factor in Quincy's price level (9% above national, BEA RPP 108.5), that paycheck buys what $438,413 would nationally. Nominal pay sits 0.8% below the Massachusetts state average.
Based on BLS state-level estimates · View source
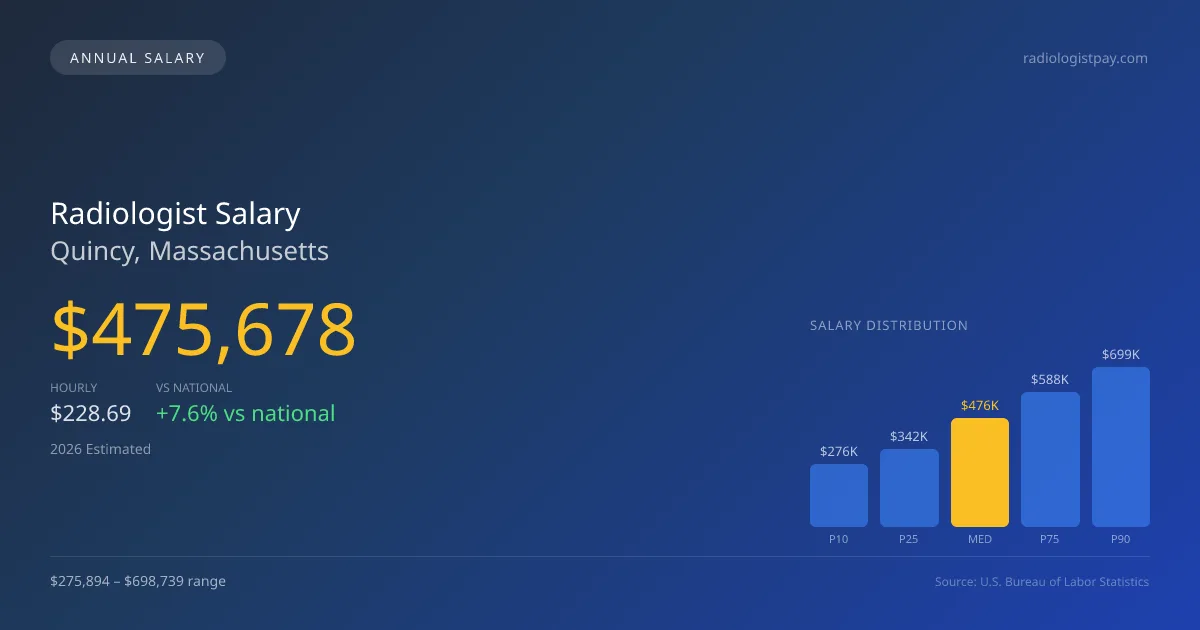
In Quincy, Massachusetts, the projected median annual salary for radiologists in 2026 is set at $475,678, placing it approximately 7.64% above the national median of $441,903. This regional compensation reflects a salary range from $275,894 at the 10th percentile to $698,739 at the 90th percentile, offering a wide spectrum of earning potentials depending on experience, subspecialty, and employment structure. The earnings landscape in Quincy illustrates a dichotomy between radiologists employed by hospitals and those participating in private partnerships. This structural divide influences compensation levels, with partnerships typically yielding higher financial rewards, particularly for those who achieve equity stakes and capitalize on teleradiology opportunities.
About the Quincy Market
Salary estimated from Massachusetts average ($410,000) adjusted for local cost of living.
Salary Breakdown
| Percentile | Annual | Hourly |
|---|---|---|
| Entry Level (P10) | $275,894 | $132.65 |
| Lower Range (P25) | $342,488 | $164.66 |
| Median (P50)(typical) | $475,678 | $228.69 |
| Upper Range (P75) | $587,733 | $282.57 |
| Top Earners (P90) | $698,739 | $335.94 |
Median Salary Position
7.64% above the national average
2026 Salary Percentile Distribution in Quincy
In Quincy, MA, the radiologist salary spread from the 10th to 90th percentile is $422,845 (2026 est.). At $475,678, the local median is 7.64% above the national median of $441,903.
Salary Calculator
At 40 hours/week in Quincy: You'd be in the lower-middle range
How Quincy Radiologist Pay Compares
Quincy median: $475,678/year (2026)
| Compared To | Median Salary | Quincy Pays |
|---|---|---|
| Massachusetts Average | $479,514 | -0.80% less |
| National Average | $441,903 | +7.64% more |
Radiologists in Quincy, MA earn a median of $475,678 per year (2026 est.), which is 7.64% higher than the national median of $441,903 and 0.80% below the Massachusetts state average of $479,514.
Cost-of-Living Adjusted Salary
Quincy has a cost of living 8.50% above the national average.
Adjusted salary = nominal × (100 / CoL index). CoL index: 100 = national average.
Quincy, MA has a cost-of-living index of 108.5 (above the national average of 100). While the nominal salary of $475,678 is competitive, the higher cost of living reduces purchasing power to an effective $438,413 — a 7.83% reduction.
Compare Purchasing Power
Select a city to see how your salary compares after cost of living
Select a city above to compare purchasing power
2021 BLS Actual
$372,706
2025 BLS Actual
$453,027
2026 Current Est.
$475,678
2021–2027 Growth
+34.0%
Salary Trajectory for Radiologists in Quincy (2021–2027)
2021–2025: actual BLS OEWS data for this metro area. 2026+: CAGR 5.00% projection.
| Year | Annual Salary | Status |
|---|---|---|
| 2021 | $372,706 | Actual |
| 2022 | $391,342 | Actual |
| 2023 | $410,909 | Actual |
| 2024 | $441,337 | Actual |
| 2025 | $453,027 | Actual |
| 2026(current) | $475,678 | Estimated |
| 2027 | $499,462 | Projected |
Based on 5 years of BLS OEWS data for the Quincy metropolitan area, the median radiologist salary grew 21.6% from $372,706 (2021) to $453,027 (2025). At a 5.00% compound annual growth rate, salaries are projected to reach $499,462 by 2027 — a total increase of $126,756 (34.01%) from 2021.
Note: Historical values (2021–2025) are actual BLS OEWS figures for the Quincy metropolitan area, sourced from annual Occupational Employment and Wage Statistics surveys. 2026–2026 figures are current estimates, and 2027 values are projections, calculated using a 5.00% CAGR derived from 5-year BLS historical data. Actual salaries may vary based on employer, experience, certifications, and local market conditions.
Salary by Experience Level
| Experience | Estimated Salary Range |
|---|---|
| 0-2 years (New Graduate) | $275,894 – $342,488 |
| 3-5 years (Mid Career) | $342,488 – $475,678 |
| 5+ years (Experienced) | $475,678 – $587,733 |
| 10+ years (Top Earner) | $587,733 – $698,739 |
MD, DO salary ranges estimated from BLS percentile data. Individual radiologist compensation varies by employer, certifications, and specialization.
Radiologist Job Market in Quincy
Currently, Quincy employs 15 radiologists, which highlights the competitive job market in the area despite localized variations in salary. The cost-of-living index stands at 108.5, indicating that while Radiology pay in Quincy, MA, is above the national average, the higher living costs may impact overall purchasing power. Radiologists in private practices often secure the highest salaries, supplemented by incentives such as RVU productivity bonuses and additional night or weekend coverage. In contrast, hospital-employed positions typically offer lower base wages but more stability. For those looking to maximize their compensation in Quincy, focusing on subspecialties like interventional radiology can yield higher premiums, while strategic negotiations and considering teleradiology projects can further enhance income potential in this shifting landscape.
More salary data for Quincy, MA:
Frequently Asked Questions
How much do radiologists make in Quincy, MA in 2026?
Is Quincy, MA a good place to work as a radiologist?
Can radiologists make $100K in Quincy?
What is the cost-of-living adjusted radiologist salary in Quincy?
How much does a radiologist make per hour in Quincy?
Related Pages
Compare Salaries
Career Resources
Nearby Cities in Massachusetts
Written by Dr. Maria Chen, MD
Career Analyst
Dr. Chen has 10 years of experience in diagnostic radiology. She specializes in imaging techniques for oncology. She works at a regional medical center.
Methodology & Data Source
Salary figures on this page are 2026 projections based on the Bureau of Labor Statistics Occupational Employment and Wage Statistics (OEWS) survey, May 2026 release. The BLS reported a median annual salary of $453,027 for radiologistsin the Quincy metropolitan area. A 5.00% compound annual growth rate (CAGR), calculated from 6-year national BLS wage trends, was applied to project current 2026 compensation. Percentile ranges (P10–P90) represent the full salary distribution across experience levels and practice settings in this market.
Data Sources & Methodology
Salary data for Quincy is estimated from official BLS state-level occupational wage data (2025), adjusted for regional cost-of-living differences using BEA RPP (Regional Price Parities).
2026 figures are projected from 2025 BLS data using a compound annual growth rate (CAGR) of 5.00%, derived from historical BLS wage trends for radiologists (SOC 29-1224).
Compiled and verified by Dr. Maria Chen, MD, a licensed radiologist with 10+ years of clinical experience. · View source data at BLS.gov