Radiologist Salary in Arlington, MA: $472,317 (2026)
Quick Answer:A full-time radiologist in Arlington, MA earns a median $472,317/year (≈ $227.07/hour) in nominal terms for 2026 — projected from BLS OEWS 2025 (SOC 29-1224). Once you factor in Arlington's price level (9% above national, BEA RPP 108.5), that paycheck buys what $435,315 would nationally. Nominal pay sits 1.5% below the Massachusetts state average.
Based on BLS state-level estimates · View source
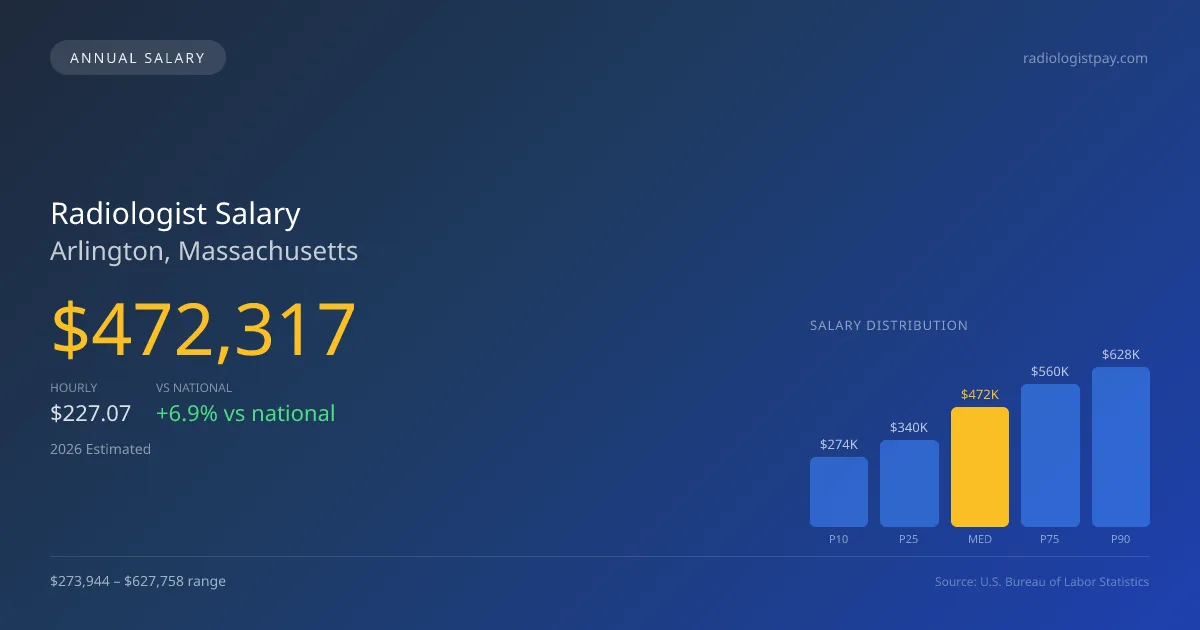
In Arlington, Massachusetts, the projected median annual salary for radiologists in 2026 is $472,317, representing a competitive compensation level compared to the national median of $441,903. Salaries vary widely, with a range from $273,944 (10th percentile) to $627,758 (90th percentile), reflecting the significant differences in employment structures. The job market is characterized by a clear divide between those in private partnerships and hospital W-2 positions, which can greatly influence compensation dynamics. Local estimates derived from 2025 BLS data and regional cost adjustments indicate that Arlington's radiologist salaries are approximately 6.88% higher than the national median, showcasing the area's demand for skilled radiologists and underscoring the ongoing changes in radiology employment models.
About the Arlington Market
Salary estimated from Massachusetts average ($410,000) adjusted for local cost of living.
Salary Breakdown
| Percentile | Annual | Hourly |
|---|---|---|
| Entry Level (P10) | $273,944 | $131.70 |
| Lower Range (P25) | $340,069 | $163.50 |
| Median (P50)(typical) | $472,317 | $227.07 |
| Upper Range (P75) | $559,764 | $269.12 |
| Top Earners (P90) | $627,758 | $301.81 |
Median Salary Position
6.88% above the national average
2026 Salary Percentile Distribution in Arlington
In Arlington, MA, the radiologist salary spread from the 10th to 90th percentile is $353,814 (2026 est.). At $472,317, the local median is 6.88% above the national median of $441,903.
Salary Calculator
At 40 hours/week in Arlington: You'd be above the median
How Arlington Radiologist Pay Compares
Arlington median: $472,317/year (2026)
| Compared To | Median Salary | Arlington Pays |
|---|---|---|
| Massachusetts Average | $479,510 | -1.50% less |
| National Average | $441,903 | +6.88% more |
Radiologists in Arlington, MA earn a median of $472,317 per year (2026 est.), which is 6.88% higher than the national median of $441,903 and 1.50% below the Massachusetts state average of $479,510.
Cost-of-Living Adjusted Salary
Arlington has a cost of living 8.50% above the national average.
Adjusted salary = nominal × (100 / CoL index). CoL index: 100 = national average.
Arlington, MA has a cost-of-living index of 108.5 (above the national average of 100). While the nominal salary of $472,317 is competitive, the higher cost of living reduces purchasing power to an effective $435,315 — a 7.83% reduction.
Compare Purchasing Power
Select a city to see how your salary compares after cost of living
Select a city above to compare purchasing power
2021 BLS Actual
$370,073
2025 BLS Actual
$449,826
2026 Current Est.
$472,317
2021–2027 Growth
+34.0%
Salary Trajectory for Radiologists in Arlington (2021–2027)
2021–2025: actual BLS OEWS data for this metro area. 2026+: CAGR 5.00% projection.
| Year | Annual Salary | Status |
|---|---|---|
| 2021 | $370,073 | Actual |
| 2022 | $388,577 | Actual |
| 2023 | $408,005 | Actual |
| 2024 | $438,219 | Actual |
| 2025 | $449,826 | Actual |
| 2026(current) | $472,317 | Estimated |
| 2027 | $495,933 | Projected |
Based on 5 years of BLS OEWS data for the Arlington metropolitan area, the median radiologist salary grew 21.6% from $370,073 (2021) to $449,826 (2025). At a 5.00% compound annual growth rate, salaries are projected to reach $495,933 by 2027 — a total increase of $125,860 (34.01%) from 2021.
Note: Historical values (2021–2025) are actual BLS OEWS figures for the Arlington metropolitan area, sourced from annual Occupational Employment and Wage Statistics surveys. 2026–2026 figures are current estimates, and 2027 values are projections, calculated using a 5.00% CAGR derived from 5-year BLS historical data. Actual salaries may vary based on employer, experience, certifications, and local market conditions.
Salary by Experience Level
| Experience | Estimated Salary Range |
|---|---|
| 0-2 years (New Graduate) | $273,944 – $340,069 |
| 3-5 years (Mid Career) | $340,069 – $472,317 |
| 5+ years (Experienced) | $472,317 – $559,764 |
| 10+ years (Top Earner) | $559,764 – $627,758 |
MD, DO salary ranges estimated from BLS percentile data. Individual radiologist compensation varies by employer, certifications, and specialization.
Radiologist Job Market in Arlington
The local job market for radiologists in Arlington is relatively small, with only nine radiologists currently employed in the area. This number may limit competition but also underscores the specialized nature of the field. The cost of living index stands at 108.5, making it essential for radiologists to consider purchasing power when negotiating salaries. Among potential employers, private radiology group practices tend to offer the highest compensation, especially for those who can leverage partnership equity stakes and are willing to take on night or weekend call coverage. Factors influencing the broad salary range include RVU productivity, subspecialty mix, and market demand for interventional radiology, which can command a premium. Radiologists looking to maximize their pay in Arlington should focus on building relationships with local practices, considering builds in RVU output, and exploring additional income opportunities through teleradiology or academic affiliations.
More salary data for Arlington, MA:
Frequently Asked Questions
How much do radiologists make in Arlington, MA in 2026?
Is Arlington, MA a good place to work as a radiologist?
Can radiologists make $100K in Arlington?
What is the cost-of-living adjusted radiologist salary in Arlington?
How much does a radiologist make per hour in Arlington?
Related Pages
Compare Salaries
Career Resources
Nearby Cities in Massachusetts
Written by Dr. Maria Chen, MD
Career Analyst
Dr. Chen has 10 years of experience in diagnostic radiology. She specializes in imaging techniques for oncology. She works at a regional medical center.
Methodology & Data Source
Salary figures on this page are 2026 projections based on the Bureau of Labor Statistics Occupational Employment and Wage Statistics (OEWS) survey, May 2026 release. The BLS reported a median annual salary of $449,826 for radiologistsin the Arlington metropolitan area. A 5.00% compound annual growth rate (CAGR), calculated from 6-year national BLS wage trends, was applied to project current 2026 compensation. Percentile ranges (P10–P90) represent the full salary distribution across experience levels and practice settings in this market.
Data Sources & Methodology
Salary data for Arlington is estimated from official BLS state-level occupational wage data (2025), adjusted for regional cost-of-living differences using BEA RPP (Regional Price Parities).
2026 figures are projected from 2025 BLS data using a compound annual growth rate (CAGR) of 5.00%, derived from historical BLS wage trends for radiologists (SOC 29-1224).
Compiled and verified by Dr. Maria Chen, MD, a licensed radiologist with 10+ years of clinical experience. · View source data at BLS.gov