Radiologist Salary in Andover, MA: $453,975 (2026)
Quick Answer:A full-time radiologist in Andover, MA earns a median $453,975/year (≈ $218.25/hour) in nominal terms for 2026 — projected from BLS OEWS 2025 (SOC 29-1224). Once you factor in Andover's price level (9% above national, BEA RPP 108.5), that paycheck buys what $418,410 would nationally. Nominal pay sits 5.3% below the Massachusetts state average.
Based on BLS state-level estimates · View source
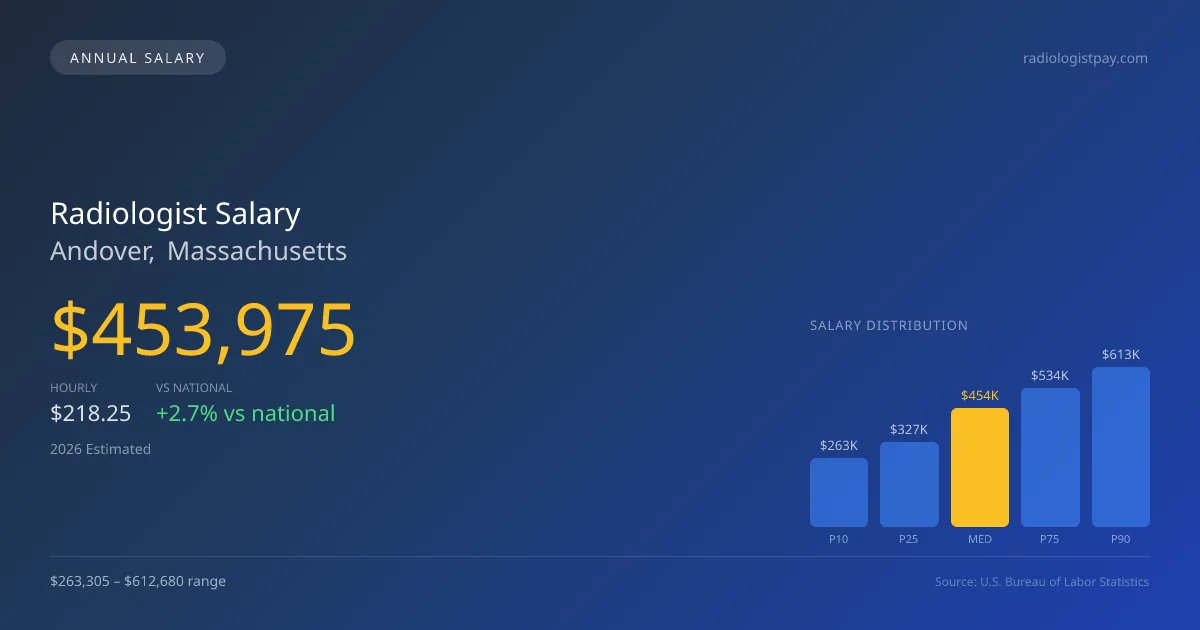
In 2026, radiologists in Andover, Massachusetts, are projected to earn a median salary of $453,975, which is slightly above the national median of $441,903, translating to a 2.73% premium for local professionals. The salary range for this specialty is broad, from $263,305 at the 10th percentile to $612,680 at the 90th percentile, reflecting the diversity in roles, experience levels, and subspecialty expertise within the field. These figures stem from estimates based on 2025 BLS state-level data and regional price parities, taking into account local economic factors. As Andover features a considerable cost of living index of 108.5—above the national average—this salary picture highlights both the opportunities and the challenges faced by radiologists striving for top compensation.
About the Andover Market
Salary estimated from Massachusetts average ($410,000) adjusted for local cost of living.
Salary Breakdown
| Percentile | Annual | Hourly |
|---|---|---|
| Entry Level (P10) | $263,305 | $126.59 |
| Lower Range (P25) | $326,862 | $157.14 |
| Median (P50)(typical) | $453,975 | $218.25 |
| Upper Range (P75) | $533,905 | $256.68 |
| Top Earners (P90) | $612,680 | $294.56 |
Median Salary Position
2.73% above the national average
2026 Salary Percentile Distribution in Andover
In Andover, MA, the radiologist salary spread from the 10th to 90th percentile is $349,375 (2026 est.). At $453,975, the local median is 2.73% above the national median of $441,903.
Salary Calculator
At 40 hours/week in Andover: You'd be above the median
How Andover Radiologist Pay Compares
Andover median: $453,975/year (2026)
| Compared To | Median Salary | Andover Pays |
|---|---|---|
| Massachusetts Average | $479,382 | -5.30% less |
| National Average | $441,903 | +2.73% more |
Radiologists in Andover, MA earn a median of $453,975 per year (2026 est.), which is 2.73% higher than the national median of $441,903 and 5.30% below the Massachusetts state average of $479,382.
Cost-of-Living Adjusted Salary
Andover has a cost of living 8.50% above the national average.
Adjusted salary = nominal × (100 / CoL index). CoL index: 100 = national average.
Andover, MA has a cost-of-living index of 108.5 (above the national average of 100). While the nominal salary of $453,975 is competitive, the higher cost of living reduces purchasing power to an effective $418,410 — a 7.83% reduction.
Compare Purchasing Power
Select a city to see how your salary compares after cost of living
Select a city above to compare purchasing power
2021 BLS Actual
$355,701
2025 BLS Actual
$432,357
2026 Current Est.
$453,975
2021–2027 Growth
+34.0%
Salary Trajectory for Radiologists in Andover (2021–2027)
2021–2025: actual BLS OEWS data for this metro area. 2026+: CAGR 5.00% projection.
| Year | Annual Salary | Status |
|---|---|---|
| 2021 | $355,701 | Actual |
| 2022 | $373,486 | Actual |
| 2023 | $392,161 | Actual |
| 2024 | $421,200 | Actual |
| 2025 | $432,357 | Actual |
| 2026(current) | $453,975 | Estimated |
| 2027 | $476,674 | Projected |
Based on 5 years of BLS OEWS data for the Andover metropolitan area, the median radiologist salary grew 21.6% from $355,701 (2021) to $432,357 (2025). At a 5.00% compound annual growth rate, salaries are projected to reach $476,674 by 2027 — a total increase of $120,973 (34.01%) from 2021.
Note: Historical values (2021–2025) are actual BLS OEWS figures for the Andover metropolitan area, sourced from annual Occupational Employment and Wage Statistics surveys. 2026–2026 figures are current estimates, and 2027 values are projections, calculated using a 5.00% CAGR derived from 5-year BLS historical data. Actual salaries may vary based on employer, experience, certifications, and local market conditions.
Salary by Experience Level
| Experience | Estimated Salary Range |
|---|---|
| 0-2 years (New Graduate) | $263,305 – $326,862 |
| 3-5 years (Mid Career) | $326,862 – $453,975 |
| 5+ years (Experienced) | $453,975 – $533,905 |
| 10+ years (Top Earner) | $533,905 – $612,680 |
MD, DO salary ranges estimated from BLS percentile data. Individual radiologist compensation varies by employer, certifications, and specialization.
Radiologist Job Market in Andover
The local job market for radiologists in Andover includes five professionals currently employed in a variety of roles, indicating a niche yet stable demand in the area. However, the higher cost of living means that take-home pay is a crucial factor for many radiologists. Employers that tend to offer more competitive salaries in Andover include private radiology group practices and hospital-employed departments, with teleradiology firms thriving particularly due to demand for night coverage positions. The variance in pay primarily hinges on factors such as RVU productivity, subspecialty focus—where interventional radiology can command a significant premium—and whether one is a partner in a practice versus a W-2 employee. For those looking to maximize their radiologist pay in Andover, aligning expertise with market demand, exploring partnership options, and considering additional teleradiology side income can be advantageous strategies.
More salary data for Andover, MA:
Frequently Asked Questions
How much do radiologists make in Andover, MA in 2026?
Is Andover, MA a good place to work as a radiologist?
Can radiologists make $100K in Andover?
What is the cost-of-living adjusted radiologist salary in Andover?
How much does a radiologist make per hour in Andover?
Related Pages
Compare Salaries
Career Resources
Nearby Cities in Massachusetts
Written by Dr. Maria Chen, MD
Career Analyst
Dr. Chen has 10 years of experience in diagnostic radiology. She specializes in imaging techniques for oncology. She works at a regional medical center.
Methodology & Data Source
Salary figures on this page are 2026 projections based on the Bureau of Labor Statistics Occupational Employment and Wage Statistics (OEWS) survey, May 2026 release. The BLS reported a median annual salary of $432,357 for radiologistsin the Andover metropolitan area. A 5.00% compound annual growth rate (CAGR), calculated from 6-year national BLS wage trends, was applied to project current 2026 compensation. Percentile ranges (P10–P90) represent the full salary distribution across experience levels and practice settings in this market.
Data Sources & Methodology
Salary data for Andover is estimated from official BLS state-level occupational wage data (2025), adjusted for regional cost-of-living differences using BEA RPP (Regional Price Parities).
2026 figures are projected from 2025 BLS data using a compound annual growth rate (CAGR) of 5.00%, derived from historical BLS wage trends for radiologists (SOC 29-1224).
Compiled and verified by Dr. Maria Chen, MD, a licensed radiologist with 10+ years of clinical experience. · View source data at BLS.gov