Radiologist Salary in Kansas: $460,981 (2026)
Quick Answer:Across Kansas's 22 metropolitan areas, the average median radiologist pay sits at $460,981/year heading into 2026 — a figure projected from 2025 BLS OEWS wage data for SOC 29-1224. Because Kansas sits at BEA RPP 90.9 (9% below the U.S. baseline), that statewide median translates to roughly $507,130 in nationally-comparable purchasing power. Highest-paying metros: Wichita ($463,360), Kansas City ($441,636), Overland Park ($441,601).
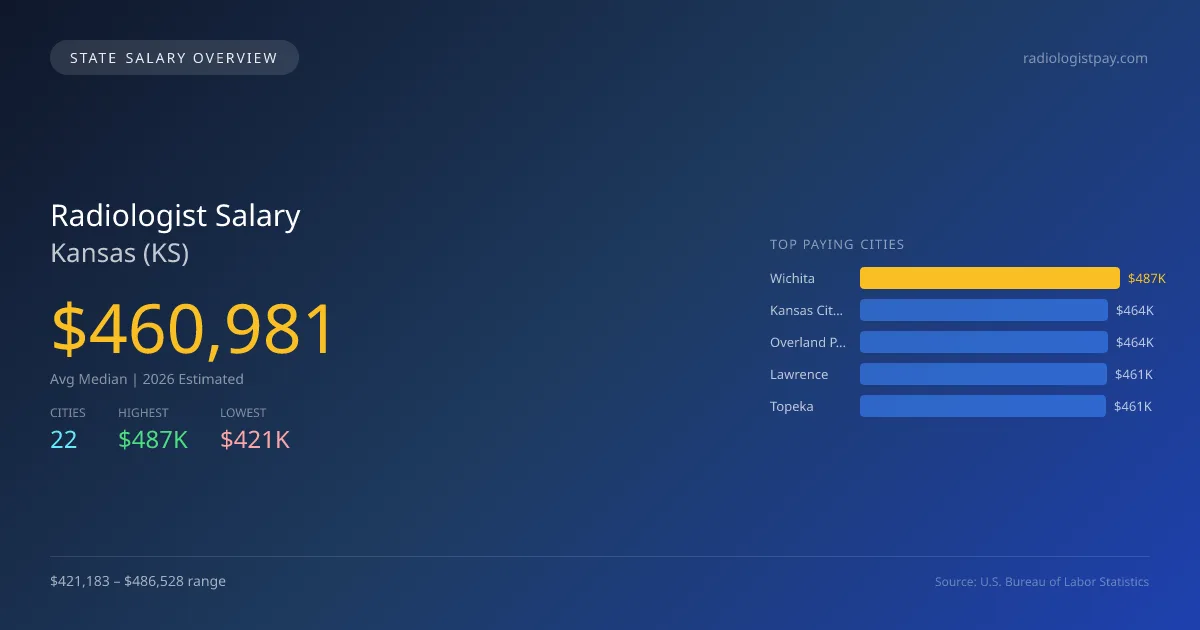
The projected average median salary for radiologists in Kansas in 2026 is $460,982, which surpasses the national median of $441,903 by 4.3%. The highest-paying city is Wichita, offering $486,528, while Emporia has the lowest at $421,183, creating a significant salary gap of $65,345. This difference can be attributed to varying demand for healthcare services, the presence of advanced medical facilities, and local living costs. Kansas has specific state licensing requirements and scope of practice laws that can influence the operational landscape for radiologists. Factors driving demand include an aging population and an increased focus on preventative care, contributing to a positive job market outlook with an anticipated growth rate of 5.00% annually. In addition to Wichita, other cities like Kansas City ($463,718), Overland Park ($463,681), Lawrence ($461,328), and Topeka ($460,621) also present strong salary opportunities for professionals in this field. With 333 radiologists currently employed statewide, the landscape indicates a stable job market, providing a solid foundation for those considering a career in radiology in Kansas.
Kansas Radiologist Salary Range
Overall salary range in Kansas: $244,287 (lowest entry-level) to $717,387 (highest top earner)
Kansas vs National Average
Kansas radiologists earn 4.32% more than the national median (+$19,078/year difference).
Kansas Radiologist Salary Distribution (2026)
Radiologist salaries in Kansas range from $267,369 (entry-level, 10th percentile) to $659,135 (top earners, 90th percentile), with a median of $460,981. The Kansas median is $19,078 above the US national median of $441,903. The average hourly rate is $221.63/hr. Approximately 333 radiologists are employed across 22 cities.
2021 BLS Actual
$361,191
2025 BLS Actual
$439,030
2026 Current Est.
$460,981
2021–2027 Growth
+34.0%
Salary Trajectory for Radiologists in Kansas (2021–2027)
2021–2025: actual BLS OEWS data for this metro area. 2026+: CAGR 5.00% projection.
| Year | Annual Salary | Status |
|---|---|---|
| 2021 | $361,191 | Actual |
| 2022 | $379,250 | Actual |
| 2023 | $398,213 | Actual |
| 2024 | $326,059 | Actual |
| 2025 | $439,030 | Actual |
| 2026(current) | $460,981 | Estimated |
| 2027 | $484,030 | Projected |
Based on 5 years of BLS OEWS data for the Kansas metropolitan area, the median radiologist salary grew 21.6% from $361,191 (2021) to $439,030 (2025). At a 5.00% compound annual growth rate, salaries are projected to reach $484,030 by 2027 — a total increase of $122,839 (34.01%) from 2021.
Note: Historical values (2021–2025) are actual BLS OEWS figures for the Kansas metropolitan area, sourced from annual Occupational Employment and Wage Statistics surveys. 2026–2026 figures are current estimates, and 2027 values are projections, calculated using a 5.00% CAGR derived from 5-year BLS historical data. Actual salaries may vary based on employer, experience, certifications, and local market conditions.
Top 5 Highest Paying Cities in Kansas
Lowest Paying Cities in Kansas
| City | Median Salary |
|---|---|
| Emporia | $421,183 |
| Gardner | $423,070 |
| Liberal | $425,506 |
| Hays | $427,154 |
| Prairie Village | $428,423 |
Best Value Cities for Radiologists in Kansas
When adjusted for local cost of living, these Kansas cities offer the most purchasing power for radiologists.
| City | Nominal Salary | CoL Index | Adjusted Salary |
|---|---|---|---|
| Wichita | $486,528 | 90.9 | $535,234 |
| Kansas City | $463,718 | 90.9 | $510,141 |
| Overland Park | $463,681 | 90.9 | $510,100 |
| Lawrence | $461,328 | 90.9 | $507,512 |
| Topeka | $460,621 | 90.9 | $506,734 |
Adjusted salary = nominal salary × (100 / CoL index). CoL index: 100 = national average. Lower index = lower cost of living.
Salary by Experience Level in Kansas
| Experience Level | Estimated Annual |
|---|---|
| Entry Level (0-2 years) | $267,369 |
| Mid Career (3-7 years) | $460,981 |
| Experienced (7+ years) | $659,135 |
Estimates based on BLS percentile data averaged across Kansas metro areas. Individual pay varies by employer, certifications, and specialization.
All 22 Cities in Kansas
| # | City | Median Salary |
|---|---|---|
| 1 | Wichita | $486,528 |
| 2 | Kansas City | $463,718 |
| 3 | Overland Park | $463,681 |
| 4 | Lawrence | $461,328 |
| 5 | Topeka | $460,621 |
| 6 | Manhattan | $458,763 |
| 7 | Olathe | $457,783 |
| 8 | Lenexa | $456,667 |
| 9 | Garden City | $452,146 |
| 10 | Derby | $449,884 |
| 11 | Hutchinson | $446,309 |
| 12 | Leavenworth | $446,167 |
| 13 | Shawnee | $444,743 |
| 14 | Salina | $441,459 |
| 15 | Leawood | $439,016 |
| 16 | Dodge City | $431,616 |
| 17 | Junction City | $430,241 |
| 18 | Prairie Village | $428,423 |
| 19 | Hays | $427,154 |
| 20 | Liberal | $425,506 |
| 21 | Gardner | $423,070 |
| 22 | Emporia | $421,183 |
More Kansas Salary Data
Senior / Experienced
Top earner salaries for experienced radiologists.
Explore More Radiologist Salary Data
Frequently Asked Questions
How much do radiologists make in Kansas in 2026?
What is the highest paying city for radiologists in Kansas?
How does Kansas radiologist pay compare to the national average?
What is the entry-level radiologist salary in Kansas?
How many radiologists are employed in Kansas?
Which Kansas city offers the best value for radiologists?
Written by Dr. Maria Chen, MD
Career Analyst
Dr. Chen has 10 years of experience in diagnostic radiology. She specializes in imaging techniques for oncology. She works at a regional medical center.
Methodology & Data Source
Statewide salary figures on this page are 2026 projections based on the Bureau of Labor Statistics Occupational Employment and Wage Statistics (OEWS) survey, May 2026 release. A 5.00% compound annual growth rate (CAGR), derived from 6-year national BLS wage trends, was applied to each metro area's reported salary to estimate current 2026 radiologist compensation across Kansas. State averages are employment-weighted across 22 metro areas — larger metro areas with more radiologistscontribute proportionally more to the average, producing figures that better reflect typical compensation. Individual pay varies by city, employer, certifications, and experience.
Data Sources & Methodology
Source: BLS, OEWS, 2-year dataset (–). Per-city data from annual BLS metropolitan area surveys.
2026 figures are projected from 2025 BLS data using a compound annual growth rate (CAGR) of 5.00%, derived from historical BLS wage trends for radiologists (SOC 29-1224).
Compiled and verified by Dr. Maria Chen, MD, a licensed radiologist with 10+ years of clinical experience. · View source data at BLS.gov