Radiologist Salary in Northbrook, IL: $423,225 (2026)
Quick Answer:A full-time radiologist in Northbrook, IL earns a median $423,225/year (≈ $203.47/hour) in nominal terms for 2026 — projected from BLS OEWS 2025 (SOC 29-1224). Once you factor in Northbrook's price level (3% below national, BEA RPP 97.1), that paycheck buys what $435,865 would nationally. Nominal pay sits 1.4% below the Illinois state average.
Based on BLS state-level estimates · View source
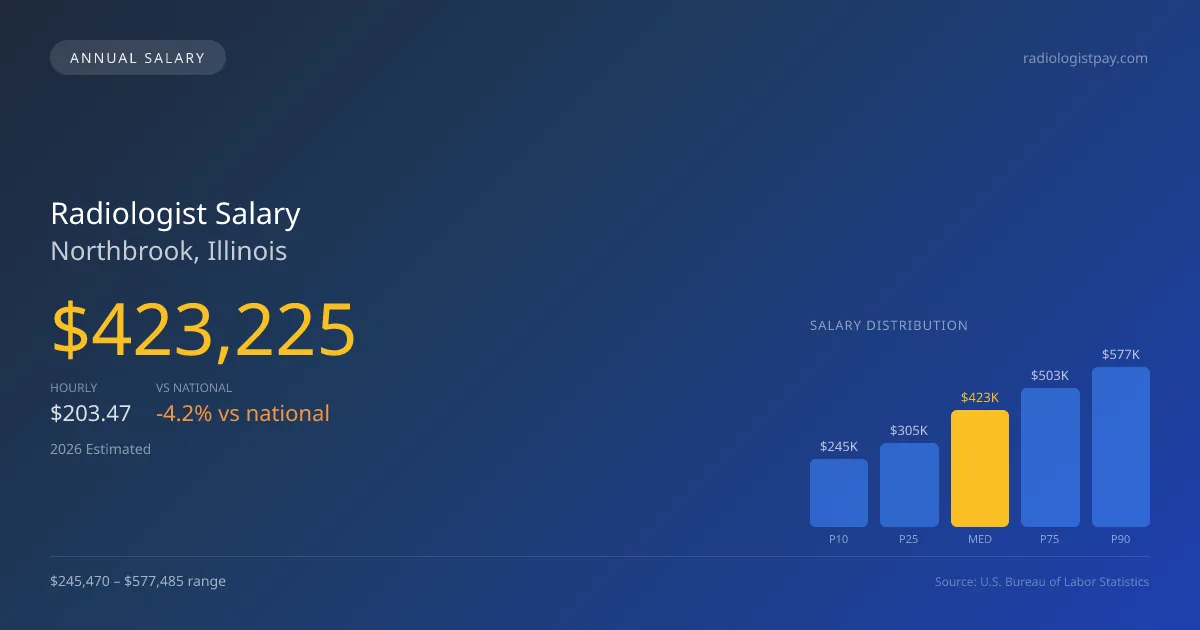
In Northbrook, Illinois, the 2026 median annual radiologist salary is projected to reach $423,225, reflecting a competitive landscape for medical professionals in the area. With a salary range spanning from $245,470 at the lowest percentile to $577,485 at the upper end, this compensation structure highlights the divide between private partnership positions and hospital-employed W-2 roles. Local data derived from 2025 BLS estimates, adjusted for regional price parities, illustrates that while compensation is slightly below the national median of $441,903, it continues to attract experts seeking both stability and higher earnings within the unique healthcare market of Northbrook. As the economy evolves, job seekers must navigate these compensation models to optimize their career trajectories.
About the Northbrook Market
Salary estimated from Illinois average ($390,000) adjusted for local cost of living.
Salary Breakdown
| Percentile | Annual | Hourly |
|---|---|---|
| Entry Level (P10) | $245,470 | $118.01 |
| Lower Range (P25) | $304,722 | $146.50 |
| Median (P50)(typical) | $423,225 | $203.47 |
| Upper Range (P75) | $502,543 | $241.61 |
| Top Earners (P90) | $577,485 | $277.64 |
Median Salary Position
4.23% below the national average
2026 Salary Percentile Distribution in Northbrook
In Northbrook, IL, the radiologist salary spread from the 10th to 90th percentile is $332,015 (2026 est.). At $423,225, the local median is 4.23% below the national median of $441,903.
Salary Calculator
At 40 hours/week in Northbrook: You'd be above the median
How Northbrook Radiologist Pay Compares
Northbrook median: $423,225/year (2026)
| Compared To | Median Salary | Northbrook Pays |
|---|---|---|
| Illinois Average | $429,234 | -1.40% less |
| National Average | $441,903 | -4.23% less |
Radiologists in Northbrook, IL earn a median of $423,225 per year (2026 est.), which is 4.23% lower than the national median of $441,903 and 1.40% below the Illinois state average of $429,234.
Cost-of-Living Adjusted Salary
Northbrook has a cost of living 2.90% below the national average, meaning your salary goes further here.
Adjusted salary = nominal × (100 / CoL index). CoL index: 100 = national average.
Northbrook, IL has a cost-of-living index of 97.1 (below the national average of 100). A radiologist earning $423,225 nominally has purchasing power equivalent to $435,865 in an average-cost city — an effective 2.99% boost.
Compare Purchasing Power
Select a city to see how your salary compares after cost of living
Select a city above to compare purchasing power
2021 BLS Actual
$331,608
2025 BLS Actual
$403,071
2026 Current Est.
$423,225
2021–2027 Growth
+34.0%
Salary Trajectory for Radiologists in Northbrook (2021–2027)
2021–2025: actual BLS OEWS data for this metro area. 2026+: CAGR 5.00% projection.
| Year | Annual Salary | Status |
|---|---|---|
| 2021 | $331,608 | Actual |
| 2022 | $348,188 | Actual |
| 2023 | $365,597 | Actual |
| 2024 | $373,515 | Actual |
| 2025 | $403,071 | Actual |
| 2026(current) | $423,225 | Estimated |
| 2027 | $444,386 | Projected |
Based on 5 years of BLS OEWS data for the Northbrook metropolitan area, the median radiologist salary grew 21.6% from $331,608 (2021) to $403,071 (2025). At a 5.00% compound annual growth rate, salaries are projected to reach $444,386 by 2027 — a total increase of $112,778 (34.01%) from 2021.
Note: Historical values (2021–2025) are actual BLS OEWS figures for the Northbrook metropolitan area, sourced from annual Occupational Employment and Wage Statistics surveys. 2026–2026 figures are current estimates, and 2027 values are projections, calculated using a 5.00% CAGR derived from 5-year BLS historical data. Actual salaries may vary based on employer, experience, certifications, and local market conditions.
Salary by Experience Level
| Experience | Estimated Salary Range |
|---|---|
| 0-2 years (New Graduate) | $245,470 – $304,722 |
| 3-5 years (Mid Career) | $304,722 – $423,225 |
| 5+ years (Experienced) | $423,225 – $502,543 |
| 10+ years (Top Earner) | $502,543 – $577,485 |
MD, DO salary ranges estimated from BLS percentile data. Individual radiologist compensation varies by employer, certifications, and specialization.
Radiologist Job Market in Northbrook
The local job market employs eight radiologists, reflecting a niche yet established presence in Northbrook, IL. With a cost-of-living index of 97.1, professionals in the area find that their take-home pay stretches further than in many regions, enhancing overall purchasing power. Among the different employers, private radiology group practices often lead in compensation due to the potential for lucrative partnership equity stakes and the advantages of RVU productivity models. The disparity in pay is influenced by factors such as subspecialty mix—interventional radiologists can command premiums of 30%-50%—and the differences in benefits tied to W-2 employment versus 1099 teleradiology arrangements. To maximize radiologist pay in Northbrook, candidates should consider seeking positions that offer equity stakes, exploring subspecialty training, and staying informed about shifts in the healthcare industry's reimbursement landscapes.
More salary data for Northbrook, IL:
Frequently Asked Questions
How much do radiologists make in Northbrook, IL in 2026?
Is Northbrook, IL a good place to work as a radiologist?
Can radiologists make $100K in Northbrook?
What is the cost-of-living adjusted radiologist salary in Northbrook?
How much does a radiologist make per hour in Northbrook?
Related Pages
Compare Salaries
Career Resources
Nearby Cities in Illinois
Written by Dr. Maria Chen, MD
Career Analyst
Dr. Chen has 10 years of experience in diagnostic radiology. She specializes in imaging techniques for oncology. She works at a regional medical center.
Methodology & Data Source
Salary figures on this page are 2026 projections based on the Bureau of Labor Statistics Occupational Employment and Wage Statistics (OEWS) survey, May 2026 release. The BLS reported a median annual salary of $403,071 for radiologistsin the Northbrook metropolitan area. A 5.00% compound annual growth rate (CAGR), calculated from 6-year national BLS wage trends, was applied to project current 2026 compensation. Percentile ranges (P10–P90) represent the full salary distribution across experience levels and practice settings in this market.
Data Sources & Methodology
Salary data for Northbrook is estimated from official BLS state-level occupational wage data (2025), adjusted for regional cost-of-living differences using BEA RPP (Regional Price Parities).
2026 figures are projected from 2025 BLS data using a compound annual growth rate (CAGR) of 5.00%, derived from historical BLS wage trends for radiologists (SOC 29-1224).
Compiled and verified by Dr. Maria Chen, MD, a licensed radiologist with 10+ years of clinical experience. · View source data at BLS.gov