Radiologist Salary in Moline, IL: $423,590 (2026)
Quick Answer:A full-time radiologist in Moline, IL earns a median $423,590/year (≈ $203.65/hour) in nominal terms for 2026 — projected from BLS OEWS 2025 (SOC 29-1224). Once you factor in Moline's price level (3% below national, BEA RPP 97.1), that paycheck buys what $436,241 would nationally. Nominal pay sits 1.3% below the Illinois state average.
Based on BLS state-level estimates · View source
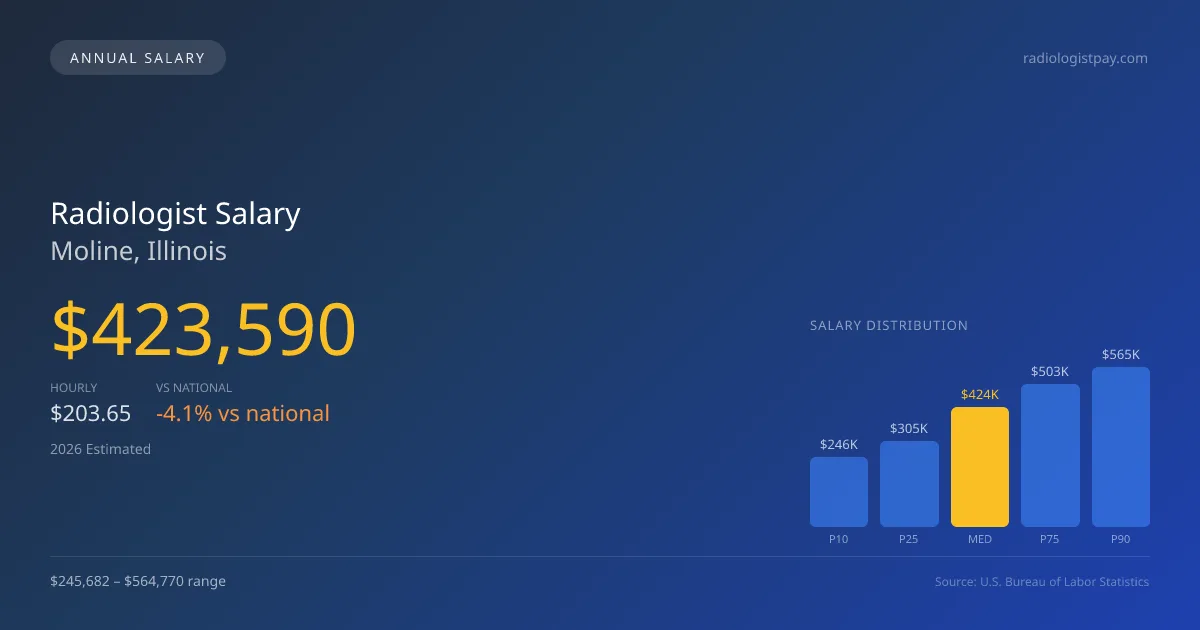
In 2026, the projected median annual salary for a radiologist in Moline, Illinois, stands at $423,590. This figure reveals a competitive market position compared to a national median of $441,903, noting a slight 4.14% dip in local compensation relative to broader trends. The salary range for radiologists in Moline spans from $245,682 at the 10th percentile to $564,770 at the 90th percentile, based on estimates derived from BLS state-level data and regional price parities. For radiologists looking to optimize their compensation, engaging in teleradiology as a side income can significantly enhance effective hourly earnings, important given the area's unique economic conditions and job market dynamics.
About the Moline Market
Salary estimated from Illinois average ($390,000) adjusted for local cost of living.
Salary Breakdown
| Percentile | Annual | Hourly |
|---|---|---|
| Entry Level (P10) | $245,682 | $118.11 |
| Lower Range (P25) | $304,985 | $146.63 |
| Median (P50)(typical) | $423,590 | $203.65 |
| Upper Range (P75) | $503,097 | $241.88 |
| Top Earners (P90) | $564,770 | $271.52 |
Median Salary Position
4.14% below the national average
2026 Salary Percentile Distribution in Moline
In Moline, IL, the radiologist salary spread from the 10th to 90th percentile is $319,088 (2026 est.). At $423,590, the local median is 4.14% below the national median of $441,903.
Salary Calculator
At 40 hours/week in Moline: You'd be above the median
How Moline Radiologist Pay Compares
Moline median: $423,590/year (2026)
| Compared To | Median Salary | Moline Pays |
|---|---|---|
| Illinois Average | $429,169 | -1.30% less |
| National Average | $441,903 | -4.14% less |
Radiologists in Moline, IL earn a median of $423,590 per year (2026 est.), which is 4.14% lower than the national median of $441,903 and 1.30% below the Illinois state average of $429,169.
Cost-of-Living Adjusted Salary
Moline has a cost of living 2.90% below the national average, meaning your salary goes further here.
Adjusted salary = nominal × (100 / CoL index). CoL index: 100 = national average.
Moline, IL has a cost-of-living index of 97.1 (below the national average of 100). A radiologist earning $423,590 nominally has purchasing power equivalent to $436,241 in an average-cost city — an effective 2.99% boost.
Compare Purchasing Power
Select a city to see how your salary compares after cost of living
Select a city above to compare purchasing power
2021 BLS Actual
$331,894
2025 BLS Actual
$403,419
2026 Current Est.
$423,590
2021–2027 Growth
+34.0%
Salary Trajectory for Radiologists in Moline (2021–2027)
2021–2025: actual BLS OEWS data for this metro area. 2026+: CAGR 5.00% projection.
| Year | Annual Salary | Status |
|---|---|---|
| 2021 | $331,894 | Actual |
| 2022 | $348,489 | Actual |
| 2023 | $365,913 | Actual |
| 2024 | $373,838 | Actual |
| 2025 | $403,419 | Actual |
| 2026(current) | $423,590 | Estimated |
| 2027 | $444,769 | Projected |
Based on 5 years of BLS OEWS data for the Moline metropolitan area, the median radiologist salary grew 21.6% from $331,894 (2021) to $403,419 (2025). At a 5.00% compound annual growth rate, salaries are projected to reach $444,769 by 2027 — a total increase of $112,875 (34.01%) from 2021.
Note: Historical values (2021–2025) are actual BLS OEWS figures for the Moline metropolitan area, sourced from annual Occupational Employment and Wage Statistics surveys. 2026–2026 figures are current estimates, and 2027 values are projections, calculated using a 5.00% CAGR derived from 5-year BLS historical data. Actual salaries may vary based on employer, experience, certifications, and local market conditions.
Salary by Experience Level
| Experience | Estimated Salary Range |
|---|---|
| 0-2 years (New Graduate) | $245,682 – $304,985 |
| 3-5 years (Mid Career) | $304,985 – $423,590 |
| 5+ years (Experienced) | $423,590 – $503,097 |
| 10+ years (Top Earner) | $503,097 – $564,770 |
MD, DO salary ranges estimated from BLS percentile data. Individual radiologist compensation varies by employer, certifications, and specialization.
Radiologist Job Market in Moline
The local job market for radiologists in Moline is relatively small, with only 10 practitioners employed in the area. This limited workforce is subject to a cost-of-living index of 97.1, indicating that living expenses are below the national average, thus allowing for more favorable take-home purchasing power. Among potential employers, private radiology group practices often lead in compensation, particularly for those holding partnership positions, which can amplify earnings significantly through RVU productivity and the equitable distribution of profits. Subspecialties like interventional radiology command higher premiums, yet there are variations in pay driven by practice structures, including the differences between W-2 employed positions and partnerships. Radiologists can strategically maximize their pay in Moline by considering night call coverage, teleradiology opportunities, and the balance between workload and remuneration, especially as job roles evolve within this changing landscape.
More salary data for Moline, IL:
Frequently Asked Questions
How much do radiologists make in Moline, IL in 2026?
Is Moline, IL a good place to work as a radiologist?
Can radiologists make $100K in Moline?
What is the cost-of-living adjusted radiologist salary in Moline?
How much does a radiologist make per hour in Moline?
Related Pages
Compare Salaries
Career Resources
Nearby Cities in Illinois
Written by Dr. Maria Chen, MD
Career Analyst
Dr. Chen has 10 years of experience in diagnostic radiology. She specializes in imaging techniques for oncology. She works at a regional medical center.
Methodology & Data Source
Salary figures on this page are 2026 projections based on the Bureau of Labor Statistics Occupational Employment and Wage Statistics (OEWS) survey, May 2026 release. The BLS reported a median annual salary of $403,419 for radiologistsin the Moline metropolitan area. A 5.00% compound annual growth rate (CAGR), calculated from 6-year national BLS wage trends, was applied to project current 2026 compensation. Percentile ranges (P10–P90) represent the full salary distribution across experience levels and practice settings in this market.
Data Sources & Methodology
Salary data for Moline is estimated from official BLS state-level occupational wage data (2025), adjusted for regional cost-of-living differences using BEA RPP (Regional Price Parities).
2026 figures are projected from 2025 BLS data using a compound annual growth rate (CAGR) of 5.00%, derived from historical BLS wage trends for radiologists (SOC 29-1224).
Compiled and verified by Dr. Maria Chen, MD, a licensed radiologist with 10+ years of clinical experience. · View source data at BLS.gov