Radiologist Salary in Bolingbrook, IL: $433,208 (2026)
Quick Answer:A full-time radiologist in Bolingbrook, IL earns a median $433,208/year (≈ $208.28/hour) in nominal terms for 2026 — projected from BLS OEWS 2025 (SOC 29-1224). Once you factor in Bolingbrook's price level (3% below national, BEA RPP 97.1), that paycheck buys what $446,146 would nationally. Nominal pay sits 1.0% above the Illinois state average.
Based on BLS state-level estimates · View source
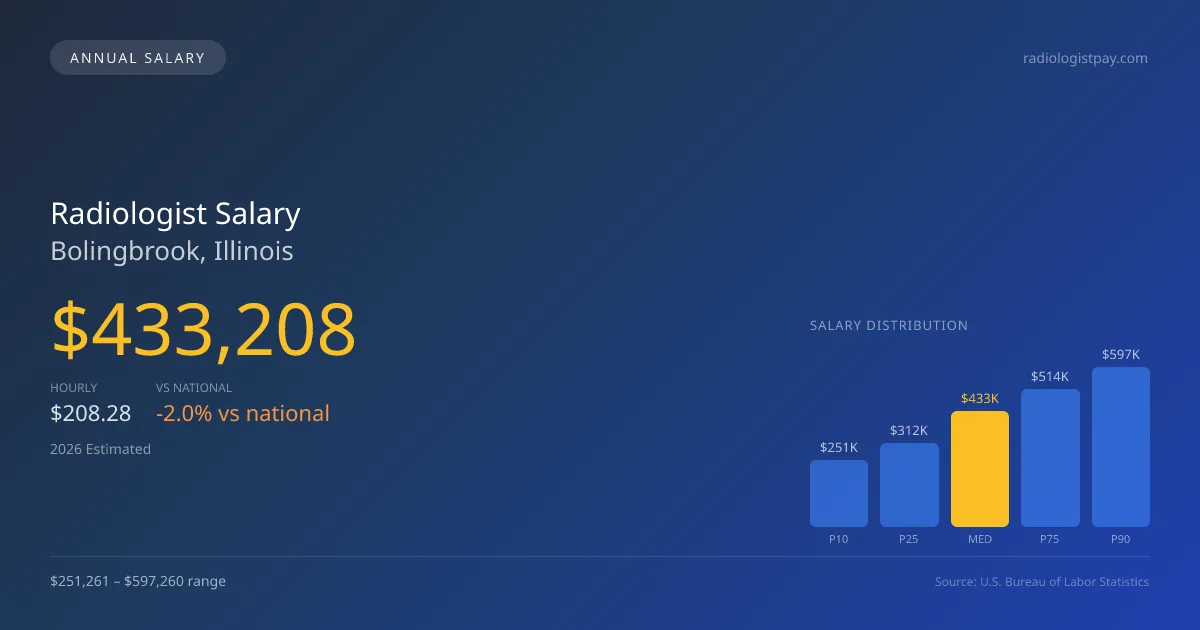
In Bolingbrook, Illinois, the projected median annual salary for radiologists in 2026 is an impressive $433,208, just slightly below the national median of $441,903. The range of salaries is notable, spanning from $251,261 at the lower end (10th percentile) to $597,260 at the upper end (90th percentile). Such figures are based on 2025 BLS OEWS data, projected to 2026, and incorporate local economic factors, including a cost of living index of 97.1, which suggests affordability relative to national averages. This varied salary scale reflects the demand for radiologists in the area and underscores the potential for lucrative teleradiology side income, enhancing effective hourly compensation beyond the base salary.
About the Bolingbrook Market
Salary estimated from Illinois average ($390,000) adjusted for local cost of living.
Salary Breakdown
| Percentile | Annual | Hourly |
|---|---|---|
| Entry Level (P10) | $251,261 | $120.80 |
| Lower Range (P25) | $311,910 | $149.96 |
| Median (P50)(typical) | $433,208 | $208.28 |
| Upper Range (P75) | $514,015 | $247.12 |
| Top Earners (P90) | $597,260 | $287.14 |
Median Salary Position
1.97% below the national average
2026 Salary Percentile Distribution in Bolingbrook
In Bolingbrook, IL, the radiologist salary spread from the 10th to 90th percentile is $345,999 (2026 est.). At $433,208, the local median is 1.97% below the national median of $441,903.
Salary Calculator
At 40 hours/week in Bolingbrook: You'd be above the median
How Bolingbrook Radiologist Pay Compares
Bolingbrook median: $433,208/year (2026)
| Compared To | Median Salary | Bolingbrook Pays |
|---|---|---|
| Illinois Average | $428,919 | +1.00% more |
| National Average | $441,903 | -1.97% less |
Radiologists in Bolingbrook, IL earn a median of $433,208 per year (2026 est.), which is 1.97% lower than the national median of $441,903 and 1.00% above the Illinois state average of $428,919.
Cost-of-Living Adjusted Salary
Bolingbrook has a cost of living 2.90% below the national average, meaning your salary goes further here.
Adjusted salary = nominal × (100 / CoL index). CoL index: 100 = national average.
Bolingbrook, IL has a cost-of-living index of 97.1 (below the national average of 100). A radiologist earning $433,208 nominally has purchasing power equivalent to $446,146 in an average-cost city — an effective 2.99% boost.
Compare Purchasing Power
Select a city to see how your salary compares after cost of living
Select a city above to compare purchasing power
2021 BLS Actual
$339,430
2025 BLS Actual
$412,579
2026 Current Est.
$433,208
2021–2027 Growth
+34.0%
Salary Trajectory for Radiologists in Bolingbrook (2021–2027)
2021–2025: actual BLS OEWS data for this metro area. 2026+: CAGR 5.00% projection.
| Year | Annual Salary | Status |
|---|---|---|
| 2021 | $339,430 | Actual |
| 2022 | $356,401 | Actual |
| 2023 | $374,221 | Actual |
| 2024 | $382,326 | Actual |
| 2025 | $412,579 | Actual |
| 2026(current) | $433,208 | Estimated |
| 2027 | $454,868 | Projected |
Based on 5 years of BLS OEWS data for the Bolingbrook metropolitan area, the median radiologist salary grew 21.6% from $339,430 (2021) to $412,579 (2025). At a 5.00% compound annual growth rate, salaries are projected to reach $454,868 by 2027 — a total increase of $115,438 (34.01%) from 2021.
Note: Historical values (2021–2025) are actual BLS OEWS figures for the Bolingbrook metropolitan area, sourced from annual Occupational Employment and Wage Statistics surveys. 2026–2026 figures are current estimates, and 2027 values are projections, calculated using a 5.00% CAGR derived from 5-year BLS historical data. Actual salaries may vary based on employer, experience, certifications, and local market conditions.
Salary by Experience Level
| Experience | Estimated Salary Range |
|---|---|
| 0-2 years (New Graduate) | $251,261 – $311,910 |
| 3-5 years (Mid Career) | $311,910 – $433,208 |
| 5+ years (Experienced) | $433,208 – $514,015 |
| 10+ years (Top Earner) | $514,015 – $597,260 |
MD, DO salary ranges estimated from BLS percentile data. Individual radiologist compensation varies by employer, certifications, and specialization.
Radiologist Job Market in Bolingbrook
The local job market shows strength with 19 radiologists employed in Bolingbrook, emphasizing the community's need for radiological services. Given the relatively low cost of living, those figures suggest decent purchasing power for professionals in the region. High-paying opportunities can be found within private radiology group practices, where partnership prospects may lead to significantly higher earnings compared to hospital-employed positions, typically lower on the pay scale. The spread between salaries often arises from various factors, including RVU productivity, specialty focus—especially interventional radiology, which commands a premium—and availability for night or weekend shifts. For radiologists in Bolingbrook, maximizing pay may involve targeting teleradiology roles or pursuing a partnership track within private practices, both of which can offer substantial financial rewards in an evolving market.
More salary data for Bolingbrook, IL:
Frequently Asked Questions
How much do radiologists make in Bolingbrook, IL in 2026?
Is Bolingbrook, IL a good place to work as a radiologist?
Can radiologists make $100K in Bolingbrook?
What is the cost-of-living adjusted radiologist salary in Bolingbrook?
How much does a radiologist make per hour in Bolingbrook?
Related Pages
Compare Salaries
Career Resources
Nearby Cities in Illinois
Written by Dr. Maria Chen, MD
Career Analyst
Dr. Chen has 10 years of experience in diagnostic radiology. She specializes in imaging techniques for oncology. She works at a regional medical center.
Methodology & Data Source
Salary figures on this page are 2026 projections based on the Bureau of Labor Statistics Occupational Employment and Wage Statistics (OEWS) survey, May 2026 release. The BLS reported a median annual salary of $412,579 for radiologistsin the Bolingbrook metropolitan area. A 5.00% compound annual growth rate (CAGR), calculated from 6-year national BLS wage trends, was applied to project current 2026 compensation. Percentile ranges (P10–P90) represent the full salary distribution across experience levels and practice settings in this market.
Data Sources & Methodology
Salary data for Bolingbrook is estimated from official BLS state-level occupational wage data (2025), adjusted for regional cost-of-living differences using BEA RPP (Regional Price Parities).
2026 figures are projected from 2025 BLS data using a compound annual growth rate (CAGR) of 5.00%, derived from historical BLS wage trends for radiologists (SOC 29-1224).
Compiled and verified by Dr. Maria Chen, MD, a licensed radiologist with 10+ years of clinical experience. · View source data at BLS.gov