Radiologist Salary in Manchester, CT: $480,863 (2026)
Quick Answer:A full-time radiologist in Manchester, CT earns a median $480,863/year (≈ $231.19/hour) in nominal terms for 2026 — projected from BLS OEWS 2025 (SOC 29-1224). Once you factor in Manchester's price level (8% above national, BEA RPP 107.9), that paycheck buys what $445,656 would nationally. Nominal pay sits 0.8% above the Connecticut state average.
Based on BLS state-level estimates · View source
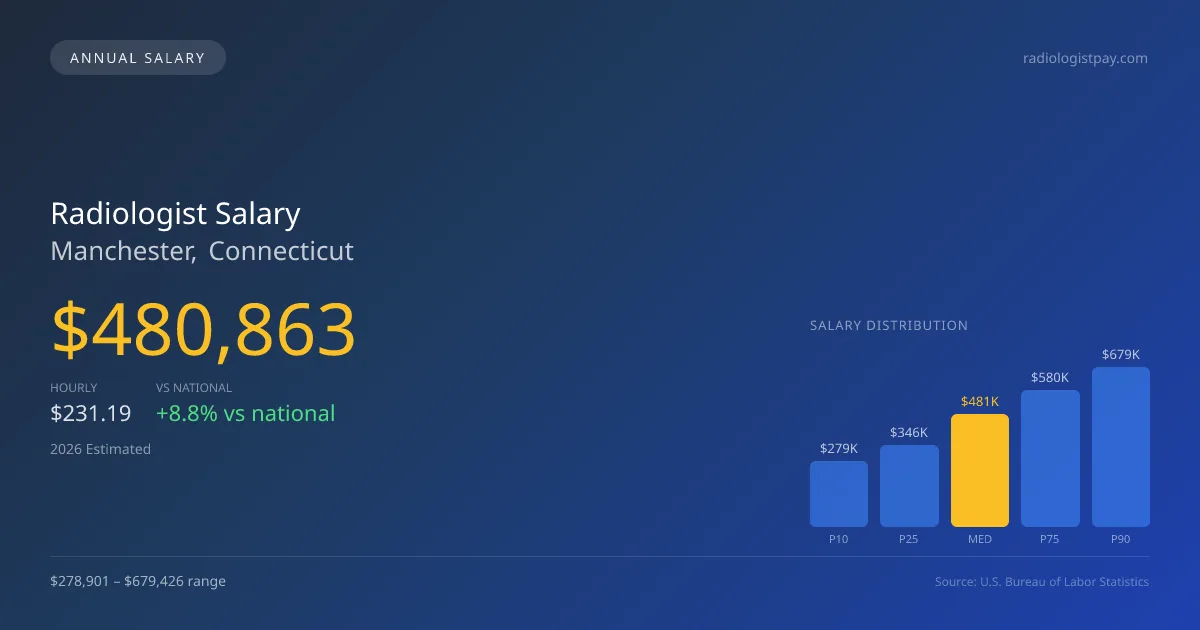
In Manchester, Connecticut, the 2026 median annual salary of $480,863 for radiologists reflects a competitive market that skews favorably compared to the national median of $441,903. The reported salary range spans from $278,901 at the 10th percentile to $679,426 at the 90th percentile, illustrating a significant variance in compensation within the field. These figures, derived from 2025 BLS data and adjusted for regional cost variations, suggest that opportunities in private partnerships may offer higher earnings potential than traditional hospital W-2 roles. The current job market in Manchester appears robust, an indicator that demand for radiologists remains steady, potentially influencing compensation trends positively.
About the Manchester Market
Salary estimated from Connecticut average ($395,000) adjusted for local cost of living.
Salary Breakdown
| Percentile | Annual | Hourly |
|---|---|---|
| Entry Level (P10) | $278,901 | $134.09 |
| Lower Range (P25) | $346,222 | $166.46 |
| Median (P50)(typical) | $480,863 | $231.19 |
| Upper Range (P75) | $580,438 | $279.06 |
| Top Earners (P90) | $679,426 | $326.64 |
Median Salary Position
8.82% above the national average
2026 Salary Percentile Distribution in Manchester
In Manchester, CT, the radiologist salary spread from the 10th to 90th percentile is $400,525 (2026 est.). At $480,863, the local median is 8.82% above the national median of $441,903.
Salary Calculator
At 40 hours/week in Manchester: You'd be above the median
How Manchester Radiologist Pay Compares
Manchester median: $480,863/year (2026)
| Compared To | Median Salary | Manchester Pays |
|---|---|---|
| Connecticut Average | $477,047 | +0.80% more |
| National Average | $441,903 | +8.82% more |
Radiologists in Manchester, CT earn a median of $480,863 per year (2026 est.), which is 8.82% higher than the national median of $441,903 and 0.80% above the Connecticut state average of $477,047.
Cost-of-Living Adjusted Salary
Manchester has a cost of living 7.90% above the national average.
Adjusted salary = nominal × (100 / CoL index). CoL index: 100 = national average.
Manchester, CT has a cost-of-living index of 107.9 (above the national average of 100). While the nominal salary of $480,863 is competitive, the higher cost of living reduces purchasing power to an effective $445,656 — a 7.32% reduction.
Compare Purchasing Power
Select a city to see how your salary compares after cost of living
Select a city above to compare purchasing power
2021 BLS Actual
$376,769
2025 BLS Actual
$457,965
2026 Current Est.
$480,863
2021–2027 Growth
+34.0%
Salary Trajectory for Radiologists in Manchester (2021–2027)
2021–2025: actual BLS OEWS data for this metro area. 2026+: CAGR 5.00% projection.
| Year | Annual Salary | Status |
|---|---|---|
| 2021 | $376,769 | Actual |
| 2022 | $395,607 | Actual |
| 2023 | $415,388 | Actual |
| 2024 | $429,825 | Actual |
| 2025 | $457,965 | Actual |
| 2026(current) | $480,863 | Estimated |
| 2027 | $504,906 | Projected |
Based on 5 years of BLS OEWS data for the Manchester metropolitan area, the median radiologist salary grew 21.6% from $376,769 (2021) to $457,965 (2025). At a 5.00% compound annual growth rate, salaries are projected to reach $504,906 by 2027 — a total increase of $128,137 (34.01%) from 2021.
Note: Historical values (2021–2025) are actual BLS OEWS figures for the Manchester metropolitan area, sourced from annual Occupational Employment and Wage Statistics surveys. 2026–2026 figures are current estimates, and 2027 values are projections, calculated using a 5.00% CAGR derived from 5-year BLS historical data. Actual salaries may vary based on employer, experience, certifications, and local market conditions.
Salary by Experience Level
| Experience | Estimated Salary Range |
|---|---|
| 0-2 years (New Graduate) | $278,901 – $346,222 |
| 3-5 years (Mid Career) | $346,222 – $480,863 |
| 5+ years (Experienced) | $480,863 – $580,438 |
| 10+ years (Top Earner) | $580,438 – $679,426 |
MD, DO salary ranges estimated from BLS percentile data. Individual radiologist compensation varies by employer, certifications, and specialization.
Radiologist Job Market in Manchester
The local employment landscape includes only 11 radiologists, creating a dynamic but competitive atmosphere for those seeking positions in Manchester CT. With a cost-of-living index at 107.9, the purchasing power of radiologists' salaries deserves thoughtful consideration, particularly in light of the financial obligations that come with living in this region. Employers such as private radiology group practices, particularly partnerships, often provide the highest compensation, while hospital employment and telemedicine options may offer distinct advantages for job security and work-life balance. The wide gap in salaries can be attributed to factors such as RVU productivity, subspecialty expertise, equity stakes in partnerships, and the degree of night or weekend call requirements. For those pursuing maximum pay in Manchester, aligning with high-revenue subspecialties like interventional radiology or exploring partnership tracks could yield substantial financial benefits, reflecting the evolving nature of radiology practice in the area.
More salary data for Manchester, CT:
Frequently Asked Questions
How much do radiologists make in Manchester, CT in 2026?
Is Manchester, CT a good place to work as a radiologist?
Can radiologists make $100K in Manchester?
What is the cost-of-living adjusted radiologist salary in Manchester?
How much does a radiologist make per hour in Manchester?
Related Pages
Compare Salaries
Career Resources
Nearby Cities in Connecticut
Written by Dr. Maria Chen, MD
Career Analyst
Dr. Chen has 10 years of experience in diagnostic radiology. She specializes in imaging techniques for oncology. She works at a regional medical center.
Methodology & Data Source
Salary figures on this page are 2026 projections based on the Bureau of Labor Statistics Occupational Employment and Wage Statistics (OEWS) survey, May 2026 release. The BLS reported a median annual salary of $457,965 for radiologistsin the Manchester metropolitan area. A 5.00% compound annual growth rate (CAGR), calculated from 6-year national BLS wage trends, was applied to project current 2026 compensation. Percentile ranges (P10–P90) represent the full salary distribution across experience levels and practice settings in this market.
Data Sources & Methodology
Salary data for Manchester is estimated from official BLS state-level occupational wage data (2025), adjusted for regional cost-of-living differences using BEA RPP (Regional Price Parities).
2026 figures are projected from 2025 BLS data using a compound annual growth rate (CAGR) of 5.00%, derived from historical BLS wage trends for radiologists (SOC 29-1224).
Compiled and verified by Dr. Maria Chen, MD, a licensed radiologist with 10+ years of clinical experience. · View source data at BLS.gov