Radiologist Salary in Bridgeport, CT: $489,345 (2026)
Quick Answer:A full-time radiologist in Bridgeport, CT earns a median $489,345/year (≈ $235.26/hour) in nominal terms for 2026 — projected from BLS OEWS 2025 (SOC 29-1224). Once you factor in Bridgeport's price level (8% above national, BEA RPP 107.9), that paycheck buys what $453,517 would nationally. Nominal pay sits 2.6% above the Connecticut state average.
Based on BLS state-level estimates · View source
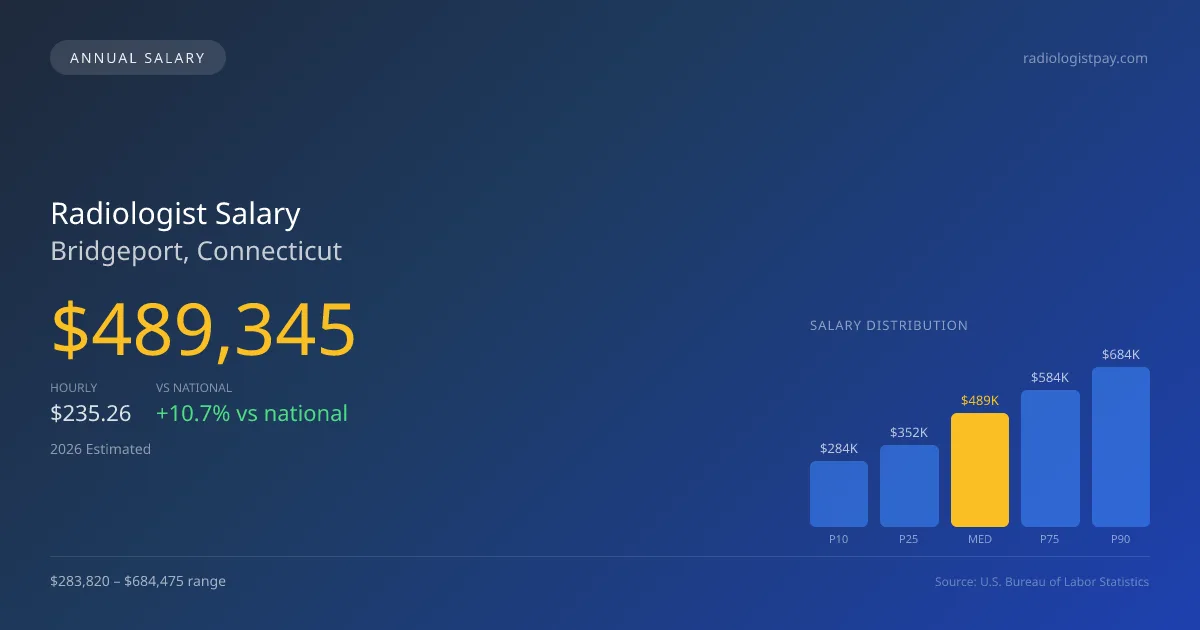
In Bridgeport, Connecticut, the median annual radiologist salary is projected to be $489,345 for 2026, which is about 10.74% higher than the national average of $441,903. The salary range for radiologists in the region varies widely, from $283,820 at the 10th percentile to $684,475 at the 90th percentile. These figures, derived from 2025 BLS data and adjusted for regional price levels, reflect a competitive job market influenced significantly by the structural divide between private partnerships and hospital W-2 positions. Such distinctions in employment types can lead to noticeable disparities in earnings, as those in partnerships often have higher compensation trajectories compared to their hospital-employed peers.
About the Bridgeport Market
Salary estimated from Connecticut average ($395,000) adjusted for local cost of living.
Salary Breakdown
| Percentile | Annual | Hourly |
|---|---|---|
| Entry Level (P10) | $283,820 | $136.45 |
| Lower Range (P25) | $352,329 | $169.39 |
| Median (P50)(typical) | $489,345 | $235.26 |
| Upper Range (P75) | $584,219 | $280.88 |
| Top Earners (P90) | $684,475 | $329.07 |
Median Salary Position
10.74% above the national average
2026 Salary Percentile Distribution in Bridgeport
In Bridgeport, CT, the radiologist salary spread from the 10th to 90th percentile is $400,655 (2026 est.). At $489,345, the local median is 10.74% above the national median of $441,903.
Salary Calculator
At 40 hours/week in Bridgeport: You'd be above the median
How Bridgeport Radiologist Pay Compares
Bridgeport median: $489,345/year (2026)
| Compared To | Median Salary | Bridgeport Pays |
|---|---|---|
| Connecticut Average | $476,945 | +2.60% more |
| National Average | $441,903 | +10.74% more |
Radiologists in Bridgeport, CT earn a median of $489,345 per year (2026 est.), which is 10.74% higher than the national median of $441,903 and 2.60% above the Connecticut state average of $476,945.
Cost-of-Living Adjusted Salary
Bridgeport has a cost of living 7.90% above the national average.
Adjusted salary = nominal × (100 / CoL index). CoL index: 100 = national average.
Bridgeport, CT has a cost-of-living index of 107.9 (above the national average of 100). While the nominal salary of $489,345 is competitive, the higher cost of living reduces purchasing power to an effective $453,517 — a 7.32% reduction.
Compare Purchasing Power
Select a city to see how your salary compares after cost of living
Select a city above to compare purchasing power
2021 BLS Actual
$383,415
2025 BLS Actual
$466,043
2026 Current Est.
$489,345
2021–2027 Growth
+34.0%
Salary Trajectory for Radiologists in Bridgeport (2021–2027)
2021–2025: actual BLS OEWS data for this metro area. 2026+: CAGR 5.00% projection.
| Year | Annual Salary | Status |
|---|---|---|
| 2021 | $383,415 | Actual |
| 2022 | $402,585 | Actual |
| 2023 | $422,715 | Actual |
| 2024 | $437,406 | Actual |
| 2025 | $466,043 | Actual |
| 2026(current) | $489,345 | Estimated |
| 2027 | $513,812 | Projected |
Based on 5 years of BLS OEWS data for the Bridgeport metropolitan area, the median radiologist salary grew 21.6% from $383,415 (2021) to $466,043 (2025). At a 5.00% compound annual growth rate, salaries are projected to reach $513,812 by 2027 — a total increase of $130,397 (34.01%) from 2021.
Note: Historical values (2021–2025) are actual BLS OEWS figures for the Bridgeport metropolitan area, sourced from annual Occupational Employment and Wage Statistics surveys. 2026–2026 figures are current estimates, and 2027 values are projections, calculated using a 5.00% CAGR derived from 5-year BLS historical data. Actual salaries may vary based on employer, experience, certifications, and local market conditions.
Salary by Experience Level
| Experience | Estimated Salary Range |
|---|---|
| 0-2 years (New Graduate) | $283,820 – $352,329 |
| 3-5 years (Mid Career) | $352,329 – $489,345 |
| 5+ years (Experienced) | $489,345 – $584,219 |
| 10+ years (Top Earner) | $584,219 – $684,475 |
MD, DO salary ranges estimated from BLS percentile data. Individual radiologist compensation varies by employer, certifications, and specialization.
Radiologist Job Market in Bridgeport
Analyzing the local job market, Bridgeport is home to 21 practicing radiologists, indicating a somewhat stable yet limited opportunity landscape. The cost of living index sits at 107.9, slightly above the national average, which impacts the purchasing power of radiologists in the area. Employers vary significantly, with private radiology groups typically offering the most lucrative positions, while hospital departments and academic medical centers generally provide stable, but often lower, pay scales. Additionally, factors such as RVU productivity, the mix of subspecialties—particularly interventional radiology, which commands greater premiums—and the benefits of partnership equity stakes all contribute to income variability. To maximize their earning potential in Bridgeport, radiologists should focus on securing partnerships, exploring teleradiology opportunities, and considering subspecialty training, thereby positioning themselves favorably within the regional healthcare market.
More salary data for Bridgeport, CT:
Frequently Asked Questions
How much do radiologists make in Bridgeport, CT in 2026?
Is Bridgeport, CT a good place to work as a radiologist?
Can radiologists make $100K in Bridgeport?
What is the cost-of-living adjusted radiologist salary in Bridgeport?
How much does a radiologist make per hour in Bridgeport?
Related Pages
Compare Salaries
Career Resources
Nearby Cities in Connecticut
Written by Dr. Maria Chen, MD
Career Analyst
Dr. Chen has 10 years of experience in diagnostic radiology. She specializes in imaging techniques for oncology. She works at a regional medical center.
Methodology & Data Source
Salary figures on this page are 2026 projections based on the Bureau of Labor Statistics Occupational Employment and Wage Statistics (OEWS) survey, May 2026 release. The BLS reported a median annual salary of $466,043 for radiologistsin the Bridgeport metropolitan area. A 5.00% compound annual growth rate (CAGR), calculated from 6-year national BLS wage trends, was applied to project current 2026 compensation. Percentile ranges (P10–P90) represent the full salary distribution across experience levels and practice settings in this market.
Data Sources & Methodology
Salary data for Bridgeport is estimated from official BLS state-level occupational wage data (2025), adjusted for regional cost-of-living differences using BEA RPP (Regional Price Parities).
2026 figures are projected from 2025 BLS data using a compound annual growth rate (CAGR) of 5.00%, derived from historical BLS wage trends for radiologists (SOC 29-1224).
Compiled and verified by Dr. Maria Chen, MD, a licensed radiologist with 10+ years of clinical experience. · View source data at BLS.gov