Radiologist Salary in San Francisco, CA: $111,300 (2026)
Quick Answer:A full-time radiologist in San Francisco, CA earns a median $111,300/year (≈ $53.51/hour) in nominal terms for 2026 — projected from BLS OEWS 2025 (SOC 29-1224). Once you factor in San Francisco's price level (16% above national, BEA RPP 115.6), that paycheck buys what $96,269 would nationally. Nominal pay sits 77.7% below the California state average.
Official BLS data · View source
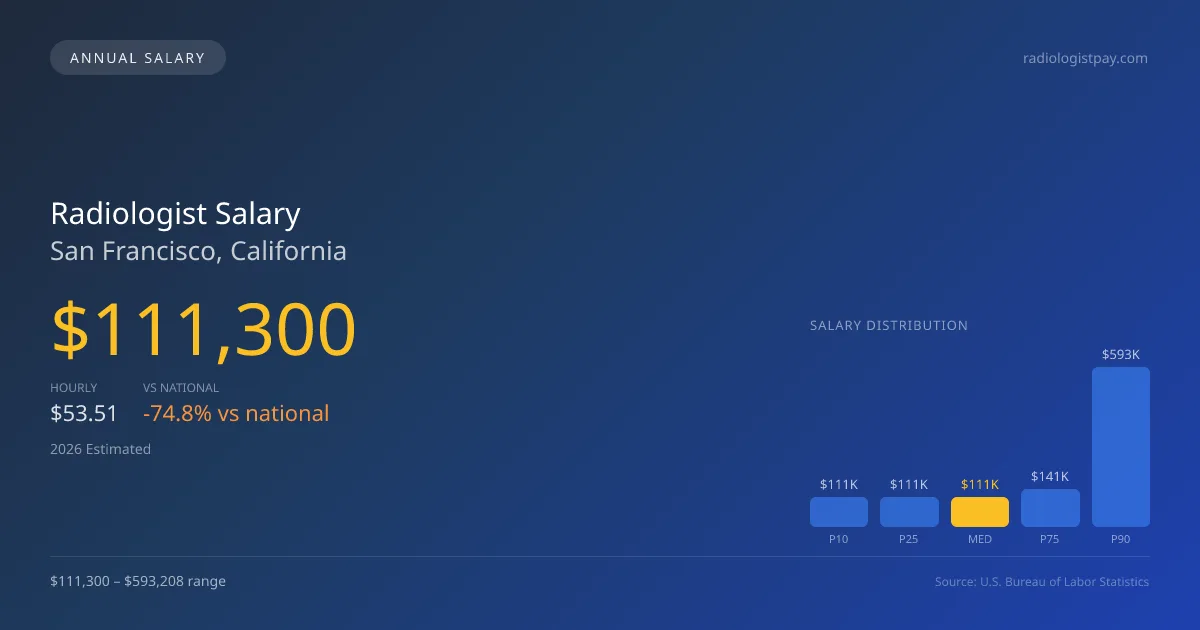
Radiologists in San Francisco, CA, are projected to earn a median annual salary of $111,300 in 2026, which is significantly lower than the national median of $441,903. This reflects the local market dynamics, where salaries range from $111,300 at the tenth percentile to a hefty $593,208 at the ninetieth percentile. The data derived from the Bureau of Labor Statistics (BLS) outlines a specialty-rich market heavily influenced by the subspecialty mix, particularly between interventional radiology (IR) and general diagnostic radiology. Given that IR practices often command up to a 30-50% salary premium, the earnings for radiologists can vary widely based on expertise and practice type, making San Francisco's job market unique.
Salary Breakdown
| Percentile | Annual | Hourly |
|---|---|---|
| Entry Level (P10) | $111,300 | $53.51 |
| Lower Range (P25) | $111,300 | $53.51 |
| Median (P50)(typical) | $111,300 | $53.51 |
| Upper Range (P75) | $141,152 | $67.86 |
| Top Earners (P90) | $593,208 | $285.20 |
Median Salary Position
74.81% below the national average
2026 Salary Percentile Distribution in San Francisco
In San Francisco, CA, the radiologist salary spread from the 10th to 90th percentile is $481,908 (2026 est.). At $111,300, the local median is 74.81% below the national median of $441,903.
Salary Calculator
At 40 hours/week in San Francisco: You'd be in the entry-level range
How San Francisco Radiologist Pay Compares
San Francisco median: $111,300/year (2026)
| Compared To | Median Salary | San Francisco Pays |
|---|---|---|
| California Average | $499,103 | -77.70% less |
| National Average | $441,903 | -74.81% less |
Radiologists in San Francisco, CA earn a median of $111,300 per year (2026 est.), which is 74.81% lower than the national median of $441,903 and 77.70% below the California state average of $499,103.
Cost-of-Living Adjusted Salary
San Francisco has a cost of living 15.61% above the national average.
Adjusted salary = nominal × (100 / CoL index). CoL index: 100 = national average.
San Francisco, CA has a cost-of-living index of 115.613 (above the national average of 100). While the nominal salary of $111,300 is competitive, the higher cost of living reduces purchasing power to an effective $96,269 — a 13.5% reduction.
Compare Purchasing Power
Select a city to see how your salary compares after cost of living
Select a city above to compare purchasing power
2021 BLS Actual
$87,206
2025 BLS Actual
$106,000
2026 Current Est.
$111,300
2021–2027 Growth
+34.0%
Salary Trajectory for Radiologists in San Francisco (2021–2027)
2021–2025: actual BLS OEWS data for this metro area. 2026+: CAGR 5.00% projection.
| Year | Annual Salary | Status |
|---|---|---|
| 2021 | $87,206 | Actual |
| 2022 | $91,567 | Actual |
| 2023 | $96,145 | Actual |
| 2024 | $553,294 | Actual |
| 2025 | $106,000 | Actual |
| 2026(current) | $111,300 | Estimated |
| 2027 | $116,865 | Projected |
Based on 5 years of BLS OEWS data for the San Francisco metropolitan area, the median radiologist salary grew 21.6% from $87,206 (2021) to $106,000 (2025). At a 5.00% compound annual growth rate, salaries are projected to reach $116,865 by 2027 — a total increase of $29,659 (34.01%) from 2021.
Note: Historical values (2021–2025) are actual BLS OEWS figures for the San Francisco metropolitan area, sourced from annual Occupational Employment and Wage Statistics surveys. 2026–2026 figures are current estimates, and 2027 values are projections, calculated using a 5.00% CAGR derived from 5-year BLS historical data. Actual salaries may vary based on employer, experience, certifications, and local market conditions.
Salary by Experience Level
| Experience | Estimated Salary Range |
|---|---|
| 0-2 years (New Graduate) | $111,300 – $111,300 |
| 3-5 years (Mid Career) | $111,300 – $111,300 |
| 5+ years (Experienced) | $111,300 – $141,152 |
| 10+ years (Top Earner) | $141,152 – $593,208 |
MD, DO salary ranges estimated from BLS percentile data. Individual radiologist compensation varies by employer, certifications, and specialization.
Radiologist Job Market in San Francisco
With 160 radiologists employed in the San Francisco area, the local job market exhibits a competitive landscape, albeit constrained by a higher cost of living index of 115.613. This index indicates that take-home pay effectively diminishes for the area's practitioners, impacting overall purchasing power. Employers that typically offer the highest salaries include private radiology group practices, particularly those structured as partnerships, and academic medical centers. Factors that drive salary disparities in this market include RVU productivity and weekend or night call coverage, which can enhance earnings significantly when combined with private practice income. Radiologists who aim to maximize their pay should consider a partnership track, examine subspecialty opportunities, or seek additional teleradiology work, especially in light of the evolving private equity landscape reshaping the industry since 2018.
More salary data for San Francisco, CA:
Frequently Asked Questions
How much do radiologists make in San Francisco, CA in 2026?
Is San Francisco, CA a good place to work as a radiologist?
Can radiologists make $100K in San Francisco?
What is the cost-of-living adjusted radiologist salary in San Francisco?
How much does a radiologist make per hour in San Francisco?
Related Pages
Compare Salaries
Career Resources
Nearby Cities in California
Written by Dr. Maria Chen, MD
Career Analyst
Dr. Chen has 10 years of experience in diagnostic radiology. She specializes in imaging techniques for oncology. She works at a regional medical center.
Methodology & Data Source
Salary figures on this page are 2026 projections based on the Bureau of Labor Statistics Occupational Employment and Wage Statistics (OEWS) survey, May 2026 release. The BLS reported a median annual salary of $106,000 for radiologistsin the San Francisco metropolitan area. A 5.00% compound annual growth rate (CAGR), calculated from 6-year national BLS wage trends, was applied to project current 2026 compensation. Percentile ranges (P10–P90) represent the full salary distribution across experience levels and practice settings in this market.
Data Sources & Methodology
Source: BLS, OEWS, 2-year dataset (–). Per-city data from annual BLS metropolitan area surveys.
2026 figures are projected from 2025 BLS data using a compound annual growth rate (CAGR) of 5.00%, derived from historical BLS wage trends for radiologists (SOC 29-1224).
Compiled and verified by Dr. Maria Chen, MD, a licensed radiologist with 10+ years of clinical experience. · View source data at BLS.gov