Radiologist Salary in Petaluma, CA: $490,064 (2026)
Quick Answer:A full-time radiologist in Petaluma, CA earns a median $490,064/year (≈ $235.61/hour) in nominal terms for 2026 — projected from BLS OEWS 2025 (SOC 29-1224). Once you factor in Petaluma's price level (13% above national, BEA RPP 113.1), that paycheck buys what $433,302 would nationally. Nominal pay sits 1.9% below the California state average.
Based on BLS state-level estimates · View source
In 2026, radiologists in Petaluma, California, can expect a median annual salary of $490,064, reflecting the influence of the structural divide between private partnerships and hospital W-2 employment upon compensation levels in the area. The salary range spans from $284,237 at the 10th percentile to $695,877 at the 90th, with local estimates derived from 2025 BLS OEWS data and adjusted for regional cost variations. This compensation trend signifies a robust earning potential in the local market, where the differentiation between various employment types directly impacts overall pay. With Petaluma becoming a focal point for healthcare services, particularly in diagnostic radiology, the implications of work arrangements are critical for professionals determining their next career steps.
About the Petaluma Market
Salary estimated from California average ($450,000) adjusted for local cost of living.
Salary Breakdown
| Percentile | Annual | Hourly |
|---|---|---|
| Entry Level (P10) | $284,237 | $136.66 |
| Lower Range (P25) | $352,846 | $169.64 |
| Median (P50)(typical) | $490,064 | $235.61 |
| Upper Range (P75) | $593,615 | $285.39 |
| Top Earners (P90) | $695,877 | $334.56 |
Median Salary Position
10.90% above the national average
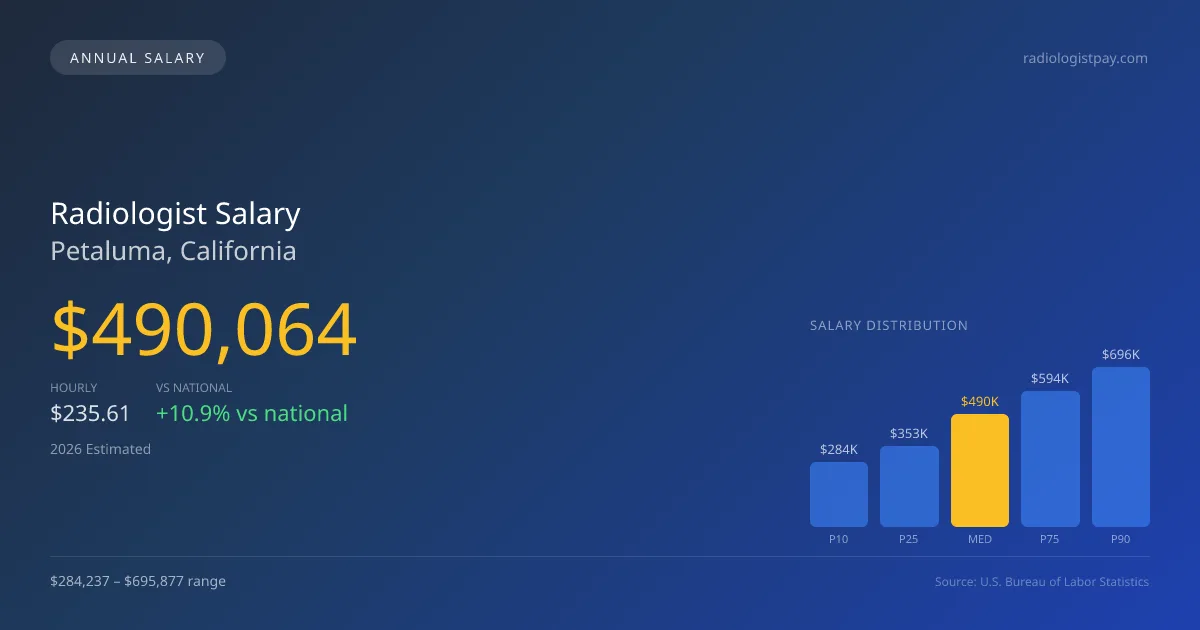
2026 Salary Percentile Distribution in Petaluma
In Petaluma, CA, the radiologist salary spread from the 10th to 90th percentile is $411,640 (2026 est.). At $490,064, the local median is 10.9% above the national median of $441,903.
Salary Calculator
At 40 hours/week in Petaluma: You'd be above the median
How Petaluma Radiologist Pay Compares
Petaluma median: $490,064/year (2026)
| Compared To | Median Salary | Petaluma Pays |
|---|---|---|
| California Average | $499,556 | -1.90% less |
| National Average | $441,903 | +10.90% more |
Radiologists in Petaluma, CA earn a median of $490,064 per year (2026 est.), which is 10.90% higher than the national median of $441,903 and 1.90% below the California state average of $499,556.
Cost-of-Living Adjusted Salary
Petaluma has a cost of living 13.10% above the national average.
Adjusted salary = nominal × (100 / CoL index). CoL index: 100 = national average.
Petaluma, CA has a cost-of-living index of 113.1 (above the national average of 100). While the nominal salary of $490,064 is competitive, the higher cost of living reduces purchasing power to an effective $433,302 — a 11.58% reduction.
Compare Purchasing Power
Select a city to see how your salary compares after cost of living
Select a city above to compare purchasing power
2021 BLS Actual
$383,978
2025 BLS Actual
$466,728
2026 Current Est.
$490,064
2021–2027 Growth
+34.0%
Salary Trajectory for Radiologists in Petaluma (2021–2027)
2021–2025: actual BLS OEWS data for this metro area. 2026+: CAGR 5.00% projection.
| Year | Annual Salary | Status |
|---|---|---|
| 2021 | $383,978 | Actual |
| 2022 | $403,177 | Actual |
| 2023 | $423,336 | Actual |
| 2024 | $499,044 | Actual |
| 2025 | $466,728 | Actual |
| 2026(current) | $490,064 | Estimated |
| 2027 | $514,568 | Projected |
Based on 5 years of BLS OEWS data for the Petaluma metropolitan area, the median radiologist salary grew 21.6% from $383,978 (2021) to $466,728 (2025). At a 5.00% compound annual growth rate, salaries are projected to reach $514,568 by 2027 — a total increase of $130,590 (34.01%) from 2021.
Note: Historical values (2021–2025) are actual BLS OEWS figures for the Petaluma metropolitan area, sourced from annual Occupational Employment and Wage Statistics surveys. 2026–2026 figures are current estimates, and 2027 values are projections, calculated using a 5.00% CAGR derived from 5-year BLS historical data. Actual salaries may vary based on employer, experience, certifications, and local market conditions.
Salary by Experience Level
| Experience | Estimated Salary Range |
|---|---|
| 0-2 years (New Graduate) | $284,237 – $352,846 |
| 3-5 years (Mid Career) | $352,846 – $490,064 |
| 5+ years (Experienced) | $490,064 – $593,615 |
| 10+ years (Top Earner) | $593,615 – $695,877 |
MD, DO salary ranges estimated from BLS percentile data. Individual radiologist compensation varies by employer, certifications, and specialization.
Radiologist Job Market in Petaluma
In the local job market, there are currently 12 radiologists employed in Petaluma, contributing to a competitive environment amid a cost of living index of 113.1, indicating that housing and other expenses are higher than the national average. Private radiology group practices and academic medical centers often offer the highest salaries due to a greater emphasis on RVU productivity, partnership equity, and subspecialty demand, particularly in interventional radiology, which commands significantly higher pay. The spread between low and high salaries is influenced by factors like weekend or night call requirements and supplemental income from teleradiology roles. For those considering a position, aligning with a profitable private group or seeking partnership opportunities can be effective strategies to maximize annual radiologist pay in Petaluma, CA.
More salary data for Petaluma, CA:
Frequently Asked Questions
How much do radiologists make in Petaluma, CA in 2026?
Is Petaluma, CA a good place to work as a radiologist?
Can radiologists make $100K in Petaluma?
What is the cost-of-living adjusted radiologist salary in Petaluma?
How much does a radiologist make per hour in Petaluma?
Related Pages
Compare Salaries
Career Resources
Nearby Cities in California
Written by Dr. Maria Chen, MD
Career Analyst
Dr. Chen has 10 years of experience in diagnostic radiology. She specializes in imaging techniques for oncology. She works at a regional medical center.
Methodology & Data Source
Salary figures on this page are 2026 projections based on the Bureau of Labor Statistics Occupational Employment and Wage Statistics (OEWS) survey, May 2026 release. The BLS reported a median annual salary of $466,728 for radiologistsin the Petaluma metropolitan area. A 5.00% compound annual growth rate (CAGR), calculated from 6-year national BLS wage trends, was applied to project current 2026 compensation. Percentile ranges (P10–P90) represent the full salary distribution across experience levels and practice settings in this market.
Data Sources & Methodology
Salary data for Petaluma is estimated from official BLS state-level occupational wage data (2025), adjusted for regional cost-of-living differences using BEA RPP (Regional Price Parities).
2026 figures are projected from 2025 BLS data using a compound annual growth rate (CAGR) of 5.00%, derived from historical BLS wage trends for radiologists (SOC 29-1224).
Compiled and verified by Dr. Maria Chen, MD, a licensed radiologist with 10+ years of clinical experience. · View source data at BLS.gov