Radiologist Salary in Ontario, CA: $511,595 (2026)
Quick Answer:A full-time radiologist in Ontario, CA earns a median $511,595/year (≈ $245.96/hour) in nominal terms for 2026 — projected from BLS OEWS 2025 (SOC 29-1224). Once you factor in Ontario's price level (13% above national, BEA RPP 113.1), that paycheck buys what $452,339 would nationally. Nominal pay sits 2.4% above the California state average.
Based on BLS state-level estimates · View source
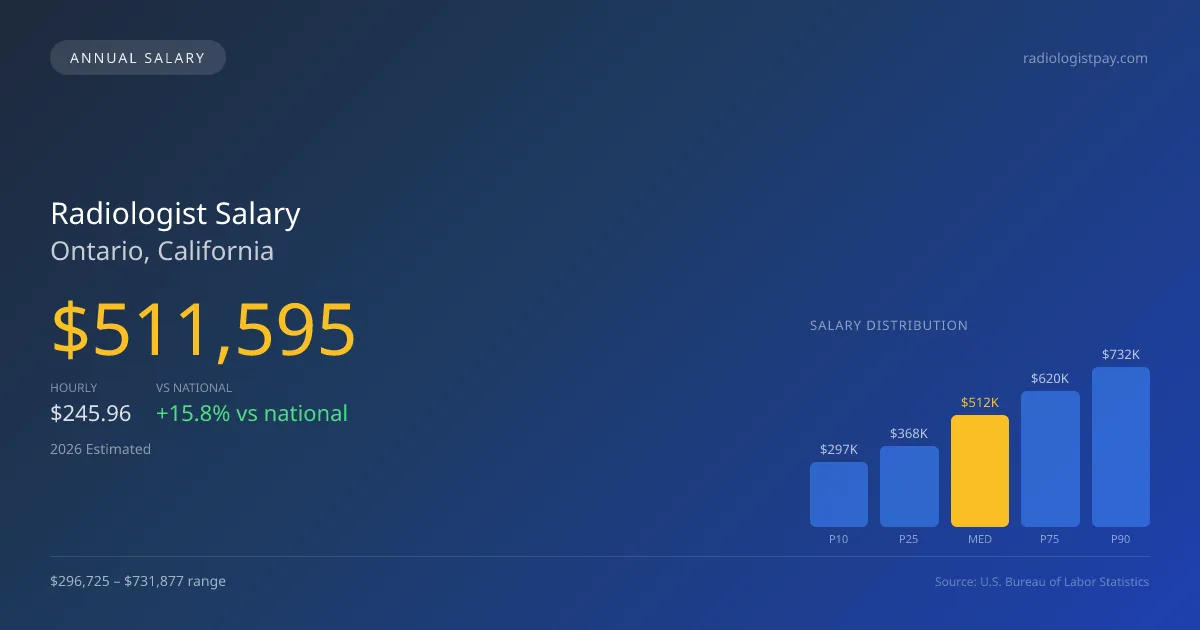
Radiologists in Ontario, California, are projected to earn a median annual salary of $511,595 in 2026, reflecting a competitive edge over the national median of $441,903. This figure captures a substantial salary range, with the lowest 10% earning approximately $296,725 while top earners can see salaries reaching as high as $731,877. These estimates are derived from 2025 BLS data, adjusted to account for the cost of living in the region, which is slightly above the national average. This elevated earning potential can be influenced by factors like teleradiology opportunities, where professionals can augment their incomes through contracted work, thereby enhancing their effective hourly compensation.
About the Ontario Market
Salary estimated from California average ($450,000) adjusted for local cost of living.
Salary Breakdown
| Percentile | Annual | Hourly |
|---|---|---|
| Entry Level (P10) | $296,725 | $142.65 |
| Lower Range (P25) | $368,348 | $177.09 |
| Median (P50)(typical) | $511,595 | $245.96 |
| Upper Range (P75) | $620,454 | $298.29 |
| Top Earners (P90) | $731,877 | $351.87 |
Median Salary Position
15.77% above the national average
2026 Salary Percentile Distribution in Ontario
In Ontario, CA, the radiologist salary spread from the 10th to 90th percentile is $435,152 (2026 est.). At $511,595, the local median is 15.77% above the national median of $441,903.
Salary Calculator
At 40 hours/week in Ontario: You'd be in the lower-middle range
How Ontario Radiologist Pay Compares
Ontario median: $511,595/year (2026)
| Compared To | Median Salary | Ontario Pays |
|---|---|---|
| California Average | $499,604 | +2.40% more |
| National Average | $441,903 | +15.77% more |
Radiologists in Ontario, CA earn a median of $511,595 per year (2026 est.), which is 15.77% higher than the national median of $441,903 and 2.40% above the California state average of $499,604.
Cost-of-Living Adjusted Salary
Ontario has a cost of living 13.10% above the national average.
Adjusted salary = nominal × (100 / CoL index). CoL index: 100 = national average.
Ontario, CA has a cost-of-living index of 113.1 (above the national average of 100). While the nominal salary of $511,595 is competitive, the higher cost of living reduces purchasing power to an effective $452,339 — a 11.58% reduction.
Compare Purchasing Power
Select a city to see how your salary compares after cost of living
Select a city above to compare purchasing power
2021 BLS Actual
$400,848
2025 BLS Actual
$487,233
2026 Current Est.
$511,595
2021–2027 Growth
+34.0%
Salary Trajectory for Radiologists in Ontario (2021–2027)
2021–2025: actual BLS OEWS data for this metro area. 2026+: CAGR 5.00% projection.
| Year | Annual Salary | Status |
|---|---|---|
| 2021 | $400,848 | Actual |
| 2022 | $420,890 | Actual |
| 2023 | $441,935 | Actual |
| 2024 | $520,969 | Actual |
| 2025 | $487,233 | Actual |
| 2026(current) | $511,595 | Estimated |
| 2027 | $537,174 | Projected |
Based on 5 years of BLS OEWS data for the Ontario metropolitan area, the median radiologist salary grew 21.6% from $400,848 (2021) to $487,233 (2025). At a 5.00% compound annual growth rate, salaries are projected to reach $537,174 by 2027 — a total increase of $136,326 (34.01%) from 2021.
Note: Historical values (2021–2025) are actual BLS OEWS figures for the Ontario metropolitan area, sourced from annual Occupational Employment and Wage Statistics surveys. 2026–2026 figures are current estimates, and 2027 values are projections, calculated using a 5.00% CAGR derived from 5-year BLS historical data. Actual salaries may vary based on employer, experience, certifications, and local market conditions.
Salary by Experience Level
| Experience | Estimated Salary Range |
|---|---|
| 0-2 years (New Graduate) | $296,725 – $368,348 |
| 3-5 years (Mid Career) | $368,348 – $511,595 |
| 5+ years (Experienced) | $511,595 – $620,454 |
| 10+ years (Top Earner) | $620,454 – $731,877 |
MD, DO salary ranges estimated from BLS percentile data. Individual radiologist compensation varies by employer, certifications, and specialization.
Radiologist Job Market in Ontario
Evaluating the local job market, there are currently 42 employed radiologists in Ontario, CA, indicating a stable demand for these specialists. The area's cost-of-living index at 113.1 suggests that while salaries are competitive, the purchasing power may be diminished compared to less expensive locales. Among the various employers in the area, private radiology partnership practices typically yield the highest compensation, averaging between $500,000 and $700,000 annually. Factors such as RVU productivity, specialization in interventional radiology, and the benefits of equity stakes in these practices contribute to this disparity in radiologist pay in Ontario. Job seekers should consider pursuing partnerships, focusing on high-demand subspecialties, and leveraging teleradiology opportunities to maximize their earnings potential in this evolving market.
More salary data for Ontario, CA:
Frequently Asked Questions
How much do radiologists make in Ontario, CA in 2026?
Is Ontario, CA a good place to work as a radiologist?
Can radiologists make $100K in Ontario?
What is the cost-of-living adjusted radiologist salary in Ontario?
How much does a radiologist make per hour in Ontario?
Related Pages
Compare Salaries
Career Resources
Nearby Cities in California
Written by Dr. Maria Chen, MD
Career Analyst
Dr. Chen has 10 years of experience in diagnostic radiology. She specializes in imaging techniques for oncology. She works at a regional medical center.
Methodology & Data Source
Salary figures on this page are 2026 projections based on the Bureau of Labor Statistics Occupational Employment and Wage Statistics (OEWS) survey, May 2026 release. The BLS reported a median annual salary of $487,233 for radiologistsin the Ontario metropolitan area. A 5.00% compound annual growth rate (CAGR), calculated from 6-year national BLS wage trends, was applied to project current 2026 compensation. Percentile ranges (P10–P90) represent the full salary distribution across experience levels and practice settings in this market.
Data Sources & Methodology
Salary data for Ontario is estimated from official BLS state-level occupational wage data (2025), adjusted for regional cost-of-living differences using BEA RPP (Regional Price Parities).
2026 figures are projected from 2025 BLS data using a compound annual growth rate (CAGR) of 5.00%, derived from historical BLS wage trends for radiologists (SOC 29-1224).
Compiled and verified by Dr. Maria Chen, MD, a licensed radiologist with 10+ years of clinical experience. · View source data at BLS.gov