Radiologist Salary in Hanford, CA: $486,106 (2026)
Quick Answer:A full-time radiologist in Hanford, CA earns a median $486,106/year (≈ $233.71/hour) in nominal terms for 2026 — projected from BLS OEWS 2025 (SOC 29-1224). Once you factor in Hanford's price level (13% above national, BEA RPP 113.1), that paycheck buys what $429,802 would nationally. Nominal pay sits 2.7% below the California state average.
Based on BLS state-level estimates · View source
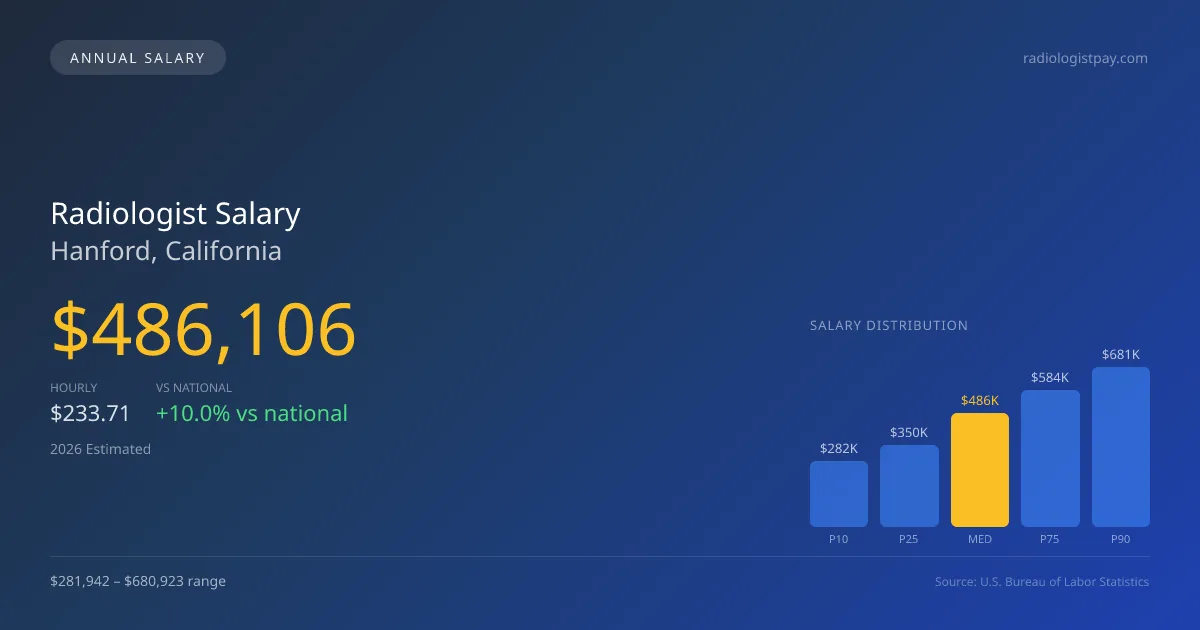
Radiologists in Hanford, CA, can expect a robust median annual salary of $486,106 in 2026, considerably higher than the national median of $441,903. The local salary landscape shows a broad range, with earnings varying from as low as $281,942 at the 10th percentile to $680,923 for top earners at the 90th percentile. These estimates derive from 2025 BLS data, adjusted for regional cost variations, and reflect the local demand for various radiologic subspecialties, including interventional radiology (IR), general diagnostics, and breast imaging. The mix of subspecialization impacts wages, as IR roles typically command significantly higher compensation. In a smaller market like Hanford, these factors combine to create competitive earnings for radiologists navigating their career paths in the region.
About the Hanford Market
Salary estimated from California average ($450,000) adjusted for local cost of living.
Salary Breakdown
| Percentile | Annual | Hourly |
|---|---|---|
| Entry Level (P10) | $281,942 | $135.54 |
| Lower Range (P25) | $349,997 | $168.26 |
| Median (P50)(typical) | $486,106 | $233.71 |
| Upper Range (P75) | $584,340 | $280.93 |
| Top Earners (P90) | $680,923 | $327.37 |
Median Salary Position
10.00% above the national average
2026 Salary Percentile Distribution in Hanford
In Hanford, CA, the radiologist salary spread from the 10th to 90th percentile is $398,981 (2026 est.). At $486,106, the local median is 10% above the national median of $441,903.
Salary Calculator
At 40 hours/week in Hanford: You'd be above the median
How Hanford Radiologist Pay Compares
Hanford median: $486,106/year (2026)
| Compared To | Median Salary | Hanford Pays |
|---|---|---|
| California Average | $499,595 | -2.70% less |
| National Average | $441,903 | +10.00% more |
Radiologists in Hanford, CA earn a median of $486,106 per year (2026 est.), which is 10.00% higher than the national median of $441,903 and 2.70% below the California state average of $499,595.
Cost-of-Living Adjusted Salary
Hanford has a cost of living 13.10% above the national average.
Adjusted salary = nominal × (100 / CoL index). CoL index: 100 = national average.
Hanford, CA has a cost-of-living index of 113.1 (above the national average of 100). While the nominal salary of $486,106 is competitive, the higher cost of living reduces purchasing power to an effective $429,802 — a 11.58% reduction.
Compare Purchasing Power
Select a city to see how your salary compares after cost of living
Select a city above to compare purchasing power
2021 BLS Actual
$380,877
2025 BLS Actual
$462,958
2026 Current Est.
$486,106
2021–2027 Growth
+34.0%
Salary Trajectory for Radiologists in Hanford (2021–2027)
2021–2025: actual BLS OEWS data for this metro area. 2026+: CAGR 5.00% projection.
| Year | Annual Salary | Status |
|---|---|---|
| 2021 | $380,877 | Actual |
| 2022 | $399,921 | Actual |
| 2023 | $419,917 | Actual |
| 2024 | $495,013 | Actual |
| 2025 | $462,958 | Actual |
| 2026(current) | $486,106 | Estimated |
| 2027 | $510,411 | Projected |
Based on 5 years of BLS OEWS data for the Hanford metropolitan area, the median radiologist salary grew 21.6% from $380,877 (2021) to $462,958 (2025). At a 5.00% compound annual growth rate, salaries are projected to reach $510,411 by 2027 — a total increase of $129,534 (34.01%) from 2021.
Note: Historical values (2021–2025) are actual BLS OEWS figures for the Hanford metropolitan area, sourced from annual Occupational Employment and Wage Statistics surveys. 2026–2026 figures are current estimates, and 2027 values are projections, calculated using a 5.00% CAGR derived from 5-year BLS historical data. Actual salaries may vary based on employer, experience, certifications, and local market conditions.
Salary by Experience Level
| Experience | Estimated Salary Range |
|---|---|
| 0-2 years (New Graduate) | $281,942 – $349,997 |
| 3-5 years (Mid Career) | $349,997 – $486,106 |
| 5+ years (Experienced) | $486,106 – $584,340 |
| 10+ years (Top Earner) | $584,340 – $680,923 |
MD, DO salary ranges estimated from BLS percentile data. Individual radiologist compensation varies by employer, certifications, and specialization.
Radiologist Job Market in Hanford
Within the Hanford job market, only ten radiologists are currently employed, reflecting a niche environment. The cost of living index stands at 113.1, which suggests that although salaries might seem attractive, local purchasing power may be tighter than in comparable markets. This economic reality can influence take-home pay significantly, particularly in relation to employer types. Typically, private radiology group practices or hospital-employed settings pay the most, while teleradiology roles often offer flexible schedules and supplemental income opportunities. Salary disparities can stem from productivity measures like RVUs, which heavily reward high-output subspecialties, particularly IR. The distinctions between W-2 employment and partnership stakes also play a crucial role in compensation structure, as those entering partnerships may see potential earnings exceed typical salaries. For radiologists aiming to maximize pay in Hanford, focusing on high-demand subspecialties, considering partnership roles, and being open to various employment models can yield significant financial benefits.
More salary data for Hanford, CA:
Frequently Asked Questions
How much do radiologists make in Hanford, CA in 2026?
Is Hanford, CA a good place to work as a radiologist?
Can radiologists make $100K in Hanford?
What is the cost-of-living adjusted radiologist salary in Hanford?
How much does a radiologist make per hour in Hanford?
Related Pages
Compare Salaries
Career Resources
Nearby Cities in California
Written by Dr. Maria Chen, MD
Career Analyst
Dr. Chen has 10 years of experience in diagnostic radiology. She specializes in imaging techniques for oncology. She works at a regional medical center.
Methodology & Data Source
Salary figures on this page are 2026 projections based on the Bureau of Labor Statistics Occupational Employment and Wage Statistics (OEWS) survey, May 2026 release. The BLS reported a median annual salary of $462,958 for radiologistsin the Hanford metropolitan area. A 5.00% compound annual growth rate (CAGR), calculated from 6-year national BLS wage trends, was applied to project current 2026 compensation. Percentile ranges (P10–P90) represent the full salary distribution across experience levels and practice settings in this market.
Data Sources & Methodology
Salary data for Hanford is estimated from official BLS state-level occupational wage data (2025), adjusted for regional cost-of-living differences using BEA RPP (Regional Price Parities).
2026 figures are projected from 2025 BLS data using a compound annual growth rate (CAGR) of 5.00%, derived from historical BLS wage trends for radiologists (SOC 29-1224).
Compiled and verified by Dr. Maria Chen, MD, a licensed radiologist with 10+ years of clinical experience. · View source data at BLS.gov