Radiologist Salary in Chino, CA: $505,344 (2026)
Quick Answer:A full-time radiologist in Chino, CA earns a median $505,344/year (≈ $242.95/hour) in nominal terms for 2026 — projected from BLS OEWS 2025 (SOC 29-1224). Once you factor in Chino's price level (13% above national, BEA RPP 113.1), that paycheck buys what $446,812 would nationally. Nominal pay sits 1.1% above the California state average.
Based on BLS state-level estimates · View source
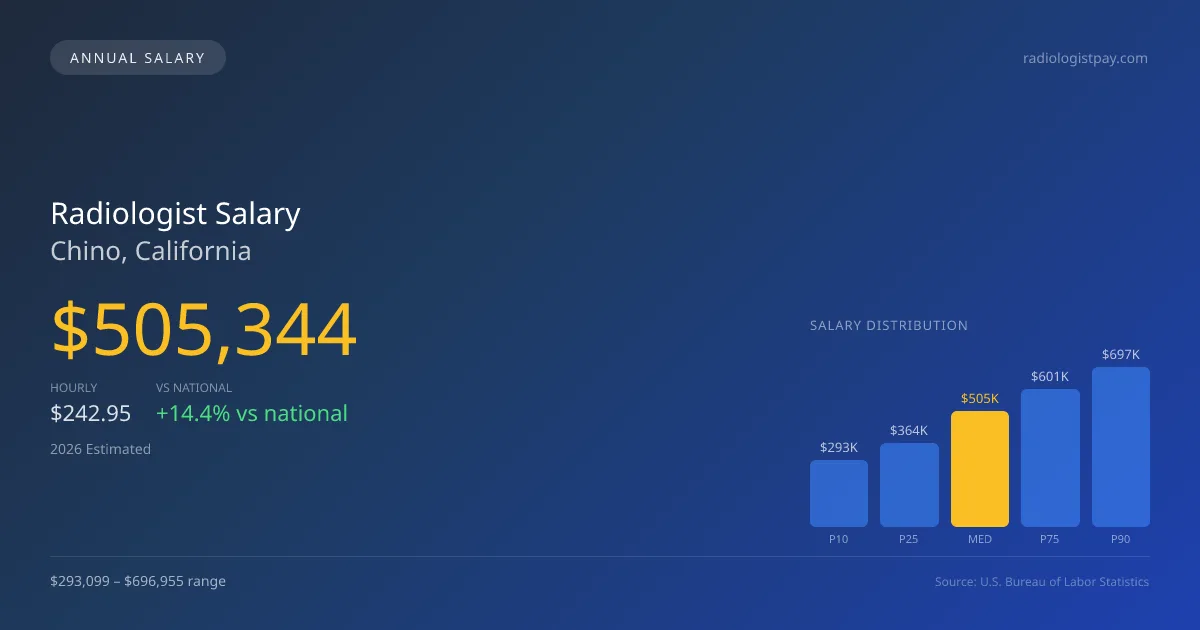
Radiologists in Chino, California, can expect a robust income in 2026, earning a median annual salary of $505,344, which exceeds the national median of $441,903 by 14.36%. The salary spectrum in this market ranges significantly, from $293,099 at the lower end (P10) to an upper tier of $696,955 (P90). These figures, derived from 2025 BLS OEWS data projected to 2026, reflect local economic conditions including the subspecialty mix, where interventional radiology (IR) positions offer substantial premiums compared to general diagnostic or breast imaging roles. The growing demand for these specialties further contributes to competitive compensation in a market that comprises only 17 radiologists, indicating a tight labor supply relative to demand.
About the Chino Market
Salary estimated from California average ($450,000) adjusted for local cost of living.
Salary Breakdown
| Percentile | Annual | Hourly |
|---|---|---|
| Entry Level (P10) | $293,099 | $140.91 |
| Lower Range (P25) | $363,848 | $174.93 |
| Median (P50)(typical) | $505,344 | $242.95 |
| Upper Range (P75) | $600,917 | $288.91 |
| Top Earners (P90) | $696,955 | $335.08 |
Median Salary Position
14.36% above the national average
2026 Salary Percentile Distribution in Chino
In Chino, CA, the radiologist salary spread from the 10th to 90th percentile is $403,856 (2026 est.). At $505,344, the local median is 14.36% above the national median of $441,903.
Salary Calculator
At 40 hours/week in Chino: You'd be above the median
How Chino Radiologist Pay Compares
Chino median: $505,344/year (2026)
| Compared To | Median Salary | Chino Pays |
|---|---|---|
| California Average | $499,846 | +1.10% more |
| National Average | $441,903 | +14.36% more |
Radiologists in Chino, CA earn a median of $505,344 per year (2026 est.), which is 14.36% higher than the national median of $441,903 and 1.10% above the California state average of $499,846.
Cost-of-Living Adjusted Salary
Chino has a cost of living 13.10% above the national average.
Adjusted salary = nominal × (100 / CoL index). CoL index: 100 = national average.
Chino, CA has a cost-of-living index of 113.1 (above the national average of 100). While the nominal salary of $505,344 is competitive, the higher cost of living reduces purchasing power to an effective $446,812 — a 11.58% reduction.
Compare Purchasing Power
Select a city to see how your salary compares after cost of living
Select a city above to compare purchasing power
2021 BLS Actual
$395,950
2025 BLS Actual
$481,280
2026 Current Est.
$505,344
2021–2027 Growth
+34.0%
Salary Trajectory for Radiologists in Chino (2021–2027)
2021–2025: actual BLS OEWS data for this metro area. 2026+: CAGR 5.00% projection.
| Year | Annual Salary | Status |
|---|---|---|
| 2021 | $395,950 | Actual |
| 2022 | $415,748 | Actual |
| 2023 | $436,535 | Actual |
| 2024 | $514,603 | Actual |
| 2025 | $481,280 | Actual |
| 2026(current) | $505,344 | Estimated |
| 2027 | $530,611 | Projected |
Based on 5 years of BLS OEWS data for the Chino metropolitan area, the median radiologist salary grew 21.6% from $395,950 (2021) to $481,280 (2025). At a 5.00% compound annual growth rate, salaries are projected to reach $530,611 by 2027 — a total increase of $134,661 (34.01%) from 2021.
Note: Historical values (2021–2025) are actual BLS OEWS figures for the Chino metropolitan area, sourced from annual Occupational Employment and Wage Statistics surveys. 2026–2026 figures are current estimates, and 2027 values are projections, calculated using a 5.00% CAGR derived from 5-year BLS historical data. Actual salaries may vary based on employer, experience, certifications, and local market conditions.
Salary by Experience Level
| Experience | Estimated Salary Range |
|---|---|
| 0-2 years (New Graduate) | $293,099 – $363,848 |
| 3-5 years (Mid Career) | $363,848 – $505,344 |
| 5+ years (Experienced) | $505,344 – $600,917 |
| 10+ years (Top Earner) | $600,917 – $696,955 |
MD, DO salary ranges estimated from BLS percentile data. Individual radiologist compensation varies by employer, certifications, and specialization.
Radiologist Job Market in Chino
In assessing the radiologist pay in Chino, CA, it's important to consider the cost of living, indexed at 113.1, which suggests a higher-than-average expense proportional to income. This reality influences take-home pay and purchasing power in the area. Employers such as private radiology groups and academic medical centers often offer the highest salaries, while hospital-employed positions may present lower yet stable opportunities. Factors like RVU productivity, partnerships that allow for equity stakes, and the need for weekend or night coverage can further widen the pay disparities seen in this field. To maximize earnings, radiologists should focus on securing roles within busy practices, consider subspecialization in high-demand areas, and be aware of the lucrative potential in teleradiology positions that provide additional income streams.
More salary data for Chino, CA:
Frequently Asked Questions
How much do radiologists make in Chino, CA in 2026?
Is Chino, CA a good place to work as a radiologist?
Can radiologists make $100K in Chino?
What is the cost-of-living adjusted radiologist salary in Chino?
How much does a radiologist make per hour in Chino?
Related Pages
Compare Salaries
Career Resources
Nearby Cities in California
Written by Dr. Maria Chen, MD
Career Analyst
Dr. Chen has 10 years of experience in diagnostic radiology. She specializes in imaging techniques for oncology. She works at a regional medical center.
Methodology & Data Source
Salary figures on this page are 2026 projections based on the Bureau of Labor Statistics Occupational Employment and Wage Statistics (OEWS) survey, May 2026 release. The BLS reported a median annual salary of $481,280 for radiologistsin the Chino metropolitan area. A 5.00% compound annual growth rate (CAGR), calculated from 6-year national BLS wage trends, was applied to project current 2026 compensation. Percentile ranges (P10–P90) represent the full salary distribution across experience levels and practice settings in this market.
Data Sources & Methodology
Salary data for Chino is estimated from official BLS state-level occupational wage data (2025), adjusted for regional cost-of-living differences using BEA RPP (Regional Price Parities).
2026 figures are projected from 2025 BLS data using a compound annual growth rate (CAGR) of 5.00%, derived from historical BLS wage trends for radiologists (SOC 29-1224).
Compiled and verified by Dr. Maria Chen, MD, a licensed radiologist with 10+ years of clinical experience. · View source data at BLS.gov