Radiologist Salary in Queen Creek, AZ: $431,836 (2026)
Quick Answer:A full-time radiologist in Queen Creek, AZ earns a median $431,836/year (≈ $207.62/hour) in nominal terms for 2026 — projected from BLS OEWS 2025 (SOC 29-1224). Once you factor in Queen Creek's price level (1% below national, BEA RPP 98.5), that paycheck buys what $438,412 would nationally. Nominal pay sits 0.8% below the Arizona state average.
Based on BLS state-level estimates · View source
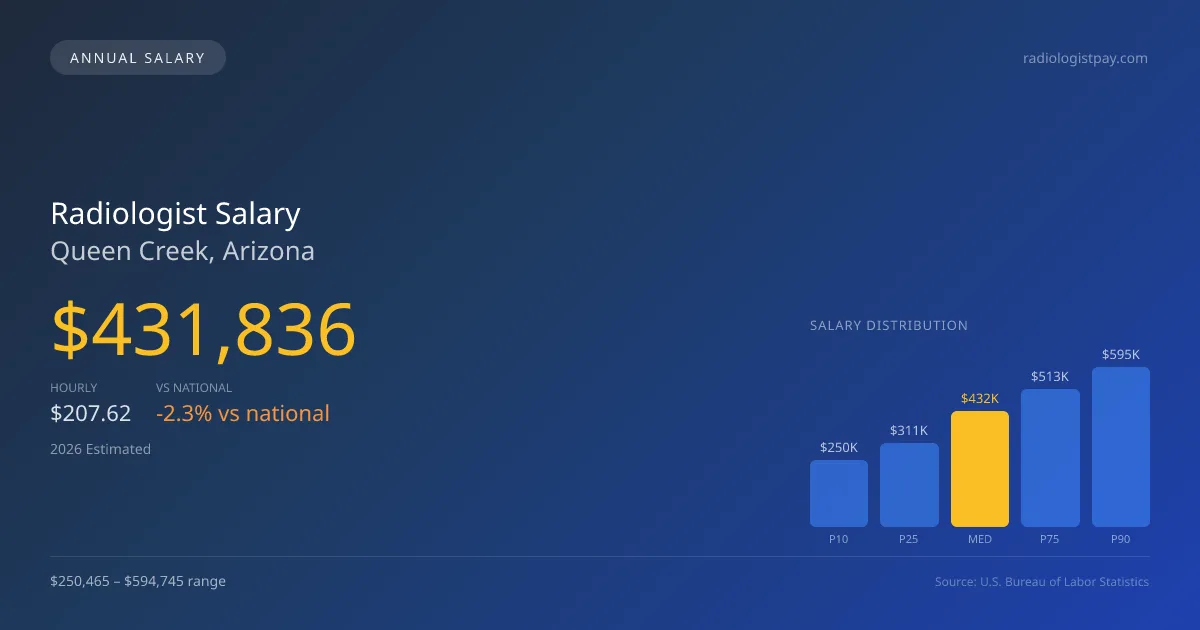
In 2026, radiologists in Queen Creek, Arizona, are expected to earn a median annual salary of $431,836, which is slightly lower than the national median of $441,903. The projected salary range for radiologists locally spans from $250,465 at the 10th percentile to $594,745 at the 90th percentile, reflecting the diversity of earnings within this medical specialty. This data comes from estimates based on 2025 BLS data and regional economic conditions, including adjustments for the local cost of living, which currently stands at a lower index of 98.5. The particular dynamics of Queen Creek’s job market, including the number of radiologists employed locally, influence these salary figures and the effective earning potential, especially as many take advantage of opportunities in teleradiology.
About the Queen Creek Market
Salary estimated from Arizona average ($370,000) adjusted for local cost of living.
Salary Breakdown
| Percentile | Annual | Hourly |
|---|---|---|
| Entry Level (P10) | $250,465 | $120.41 |
| Lower Range (P25) | $310,922 | $149.48 |
| Median (P50)(typical) | $431,836 | $207.62 |
| Upper Range (P75) | $513,009 | $246.63 |
| Top Earners (P90) | $594,745 | $285.94 |
Median Salary Position
2.28% below the national average
2026 Salary Percentile Distribution in Queen Creek
In Queen Creek, AZ, the radiologist salary spread from the 10th to 90th percentile is $344,280 (2026 est.). At $431,836, the local median is 2.28% below the national median of $441,903.
Salary Calculator
At 40 hours/week in Queen Creek: You'd be above the median
How Queen Creek Radiologist Pay Compares
Queen Creek median: $431,836/year (2026)
| Compared To | Median Salary | Queen Creek Pays |
|---|---|---|
| Arizona Average | $435,318 | -0.80% less |
| National Average | $441,903 | -2.28% less |
Radiologists in Queen Creek, AZ earn a median of $431,836 per year (2026 est.), which is 2.28% lower than the national median of $441,903 and 0.80% below the Arizona state average of $435,318.
Cost-of-Living Adjusted Salary
Queen Creek has a cost of living 1.50% below the national average, meaning your salary goes further here.
Adjusted salary = nominal × (100 / CoL index). CoL index: 100 = national average.
Queen Creek, AZ has a cost-of-living index of 98.5 (below the national average of 100). A radiologist earning $431,836 nominally has purchasing power equivalent to $438,412 in an average-cost city — an effective 1.52% boost.
Compare Purchasing Power
Select a city to see how your salary compares after cost of living
Select a city above to compare purchasing power
2021 BLS Actual
$338,354
2025 BLS Actual
$411,272
2026 Current Est.
$431,836
2021–2027 Growth
+34.0%
Salary Trajectory for Radiologists in Queen Creek (2021–2027)
2021–2025: actual BLS OEWS data for this metro area. 2026+: CAGR 5.00% projection.
| Year | Annual Salary | Status |
|---|---|---|
| 2021 | $338,354 | Actual |
| 2022 | $355,272 | Actual |
| 2023 | $373,036 | Actual |
| 2024 | $361,570 | Actual |
| 2025 | $411,272 | Actual |
| 2026(current) | $431,836 | Estimated |
| 2027 | $453,427 | Projected |
Based on 5 years of BLS OEWS data for the Queen Creek metropolitan area, the median radiologist salary grew 21.6% from $338,354 (2021) to $411,272 (2025). At a 5.00% compound annual growth rate, salaries are projected to reach $453,427 by 2027 — a total increase of $115,073 (34.01%) from 2021.
Note: Historical values (2021–2025) are actual BLS OEWS figures for the Queen Creek metropolitan area, sourced from annual Occupational Employment and Wage Statistics surveys. 2026–2026 figures are current estimates, and 2027 values are projections, calculated using a 5.00% CAGR derived from 5-year BLS historical data. Actual salaries may vary based on employer, experience, certifications, and local market conditions.
Salary by Experience Level
| Experience | Estimated Salary Range |
|---|---|
| 0-2 years (New Graduate) | $250,465 – $310,922 |
| 3-5 years (Mid Career) | $310,922 – $431,836 |
| 5+ years (Experienced) | $431,836 – $513,009 |
| 10+ years (Top Earner) | $513,009 – $594,745 |
MD, DO salary ranges estimated from BLS percentile data. Individual radiologist compensation varies by employer, certifications, and specialization.
Radiologist Job Market in Queen Creek
An analysis of the local job market reveals that there are currently 11 radiologists working in Queen Creek, each facing a cost-of-living reality that affects their take-home purchasing power. Given the locality's lower cost index, radiologists may find their earnings stretch further, yet competition and varying employer types can lead to discrepancies in pay. Private radiology group practices often offer the highest salaries, potentially in partnership tracks, compared to hospital-employed roles, which typically grant the security of W-2 employment. Factors such as RVU productivity, subspecialty selection—where interventional radiology (IR) can command a significant pay premium—and teleradiology income, particularly for night coverage, contribute to the pay spread. To maximize their earnings in this specific market, radiologists might consider pursuing partnerships, enhancing their subspecialty skills, or exploring flexible teleradiology options alongside traditional practices in Queen Creek, AZ.
More salary data for Queen Creek, AZ:
Frequently Asked Questions
How much do radiologists make in Queen Creek, AZ in 2026?
Is Queen Creek, AZ a good place to work as a radiologist?
Can radiologists make $100K in Queen Creek?
What is the cost-of-living adjusted radiologist salary in Queen Creek?
How much does a radiologist make per hour in Queen Creek?
Related Pages
Compare Salaries
Career Resources
Nearby Cities in Arizona
Written by Dr. Maria Chen, MD
Career Analyst
Dr. Chen has 10 years of experience in diagnostic radiology. She specializes in imaging techniques for oncology. She works at a regional medical center.
Methodology & Data Source
Salary figures on this page are 2026 projections based on the Bureau of Labor Statistics Occupational Employment and Wage Statistics (OEWS) survey, May 2026 release. The BLS reported a median annual salary of $411,272 for radiologistsin the Queen Creek metropolitan area. A 5.00% compound annual growth rate (CAGR), calculated from 6-year national BLS wage trends, was applied to project current 2026 compensation. Percentile ranges (P10–P90) represent the full salary distribution across experience levels and practice settings in this market.
Data Sources & Methodology
Salary data for Queen Creek is estimated from official BLS state-level occupational wage data (2025), adjusted for regional cost-of-living differences using BEA RPP (Regional Price Parities).
2026 figures are projected from 2025 BLS data using a compound annual growth rate (CAGR) of 5.00%, derived from historical BLS wage trends for radiologists (SOC 29-1224).
Compiled and verified by Dr. Maria Chen, MD, a licensed radiologist with 10+ years of clinical experience. · View source data at BLS.gov