Radiologist Hourly Pay in Richland, WA: $230.60 (2026)
Quick Answer:Hourly pay for a radiologist working in Richland, WA runs $230.60 at the median for 2026 — annualizing to $479,651 at a standard 2,080-hour year. Figures projected from BLS OEWS 2025 (SOC 29-1224). Weighted against Richland's regional price level (BEA RPP 107.4, 7% above national), each hour of work buys what $214.71 nationally would. A 24-hour part-time schedule grosses $287,790 per year.
Based on BLS state-level estimates · View source
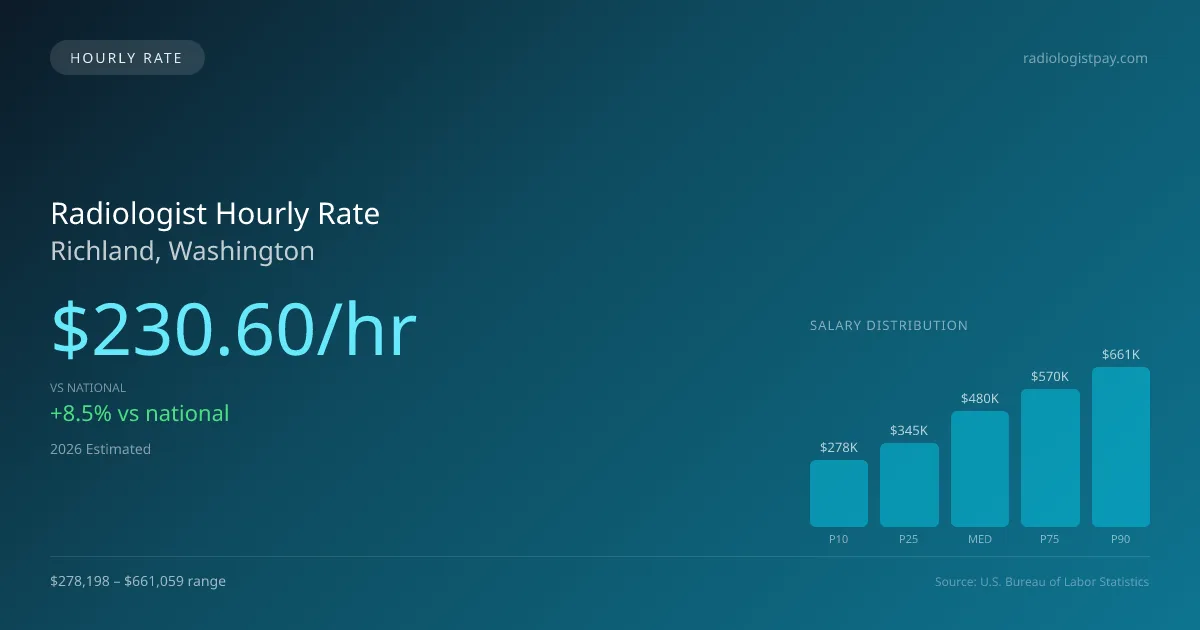
Radiologists in Richland, Washington, are projected to earn a median hourly pay of $230.60 in 2026, which exceeds the national average of $212.45 per hour by 8.54%. This favorable hourly rate provides an attractive option for both full-time and part-time practitioners, with part-time radiologists working three days a week typically drawing from this rate. The hourly wage for radiologists in Richland ranges from $133.75 for entry-level positions to $317.81 for those at the top of their profession, reflecting the varying levels of experience and specialization. These estimates, derived from annual salary data, align with the diverse work environments of radiologists, which include hospital reading rooms, outpatient imaging centers, interventional radiology procedure suites, and remote home reading stations, making the profession versatile and adaptable to different working styles.
About the Richland Market
Salary estimated from Washington average ($410,000) adjusted for local cost of living.
Radiologist Hourly Wage Breakdown
| Percentile | Hourly Rate | Per 8hr Shift |
|---|---|---|
| Entry Level (P10) | $133.75 | $1069.99 |
| Lower Range (P25) | $166.04 | $1328.29 |
| Median (P50) | $230.60 | $1844.81 |
| Upper Range (P75) | $274.26 | $2194.08 |
| Top Earners (P90) | $317.81 | $2542.51 |
Estimated Annual Income by Work Schedule in Richland
Based on $230.60/hr median hourly rate · 2026 est.
At $230.60/hr, a radiologist working full-time (40 hr/wk) in Richland, WA can expect to earn approximately $479,650 per year (2026 est.). Part-time hygienists working 24 hours per week would earn around $276,721. With a cost-of-living index of 107.40 (above the national average), these earnings may be offset by higher expenses in Richland.
Hourly Rate Calculator
Schedule Comparison in Richland
| Schedule | Weekly | Monthly | Annual |
|---|---|---|---|
| Full-Time (40 hrs) | $9,224.04 | $39,971 | $479,650 |
| Part-Time (24 hrs) | $5,534.42 | $23,983 | $287,790 |
| Per Diem (16 hrs) | $3,689.62 | $15,988 | $191,860 |
Compare MD, DO Wages With Similar Roles
| Role | Median Hourly |
|---|---|
| Radiologist (Richland) | $230.60 |
| Anesthesiologist (National Avg) | $168.27 |
| Cardiologist (National Avg) | $168.27 |
| Radiologic Technologist (National Avg) | $36.15 |
| Diagnostic Medical Sonographer (National Avg) | $40.79 |
Radiologists in Richland, WA earn a median of $479,651 per year (2026 est.), which is 8.54% higher than the national median of $441,903 and 1.10% above the Washington state average of $474,432.
Radiologist Hourly Pay vs. Cost of Living
Working 24h/week at $230.60/hr = $287,790/year (purchasing power: $267,961).
Working 40h/week (full-time) = $479,650/year (purchasing power: $446,602).
CoL index: 107.4 (100 = national average).
2021 BLS Actual
$180.68/hr
2025 BLS Actual
$219.62/hr
2026 Current Est.
$230.60/hr
2021–2027 Growth
+34.0%
Hourly Rate Trajectory for Radiologists in Richland (2021–2027)
2021–2025: actual BLS OEWS data for this metro area. 2026+: CAGR 5.00% projection.
| Year | Hourly Rate | Status |
|---|---|---|
| 2021 | $180.68/hr | Actual |
| 2022 | $189.72/hr | Actual |
| 2023 | $199.20/hr | Actual |
| 2024 | $213.95/hr | Actual |
| 2025 | $219.62/hr | Actual |
| 2026(current) | $230.60/hr | Estimated |
| 2027 | $242.13/hr | Projected |
Based on 5 years of BLS OEWS metropolitan area data, the median hourly rate for radiologists in Richland grew 21.6% from $180.68/hr (2021) to $219.62/hr (2025). At a 5.00% projected growth rate, hourly pay is expected to reach $242.13/hr by 2027. Part-time and per-diem radiologists can use this multi-year trend to benchmark future contract negotiations.
Note: Historical values (2021–2025) are actual BLS OEWS figures for the Richland metropolitan area, sourced from annual Occupational Employment and Wage Statistics surveys. 2026–2026 figures are current estimates, and 2027 values are projections, calculated using a 5.00% CAGR derived from 5-year BLS historical data. Actual salaries may vary based on employer, experience, certifications, and local market conditions.
Working as an Hourly Radiologist in Richland
Part-time radiologists in Richland, committed to a three-day work week, can expect to take home approximately $179,000 annually, a solid income compared to the full-time counterparts. Furthermore, per diem radiologist pay in Richland can be significantly higher, with night-hawk shifts earning between $1,200 and $2,500 overnight and weekend coverage ranging from $1,500 to $3,000 per day. For subspecialty interventional radiology locum work at understaffed centers, earnings may exceed $3,000 in a single day. The hourly rates can vary depending on the type of employer; private radiology group practices, hospital-employed departments, teleradiology firms, academic medical centers, and the VA system all provide distinct compensation packages. Radiologists may choose lower hourly rates for positions offering benefits, such as health insurance, while forgoing those perks for higher hourly rates in private practice or agency work. To maximize earnings, understanding the negotiation landscape is key, where emphasizing specialized skills and potential productivity can yield more favorable terms for hourly pay in Richland, WA.
More salary data for Richland, WA:
Frequently Asked Questions
What is the hourly rate for radiologists in Richland in 2026?
How much do part-time radiologists make in Richland?
Are radiologists in Richland paid hourly or salary?
How much does a full-time radiologist make per year in Richland?
Do radiologists earn more per hour working part-time in Richland?
Related Pages
Compare Salaries
Career Resources
Nearby Cities in Washington
Written by Dr. Maria Chen, MD
Career Analyst
Dr. Chen has 10 years of experience in diagnostic radiology. She specializes in imaging techniques for oncology. She works at a regional medical center.
Methodology & Data Source
Hourly wage figures on this page are 2026 projections based on the Bureau of Labor Statistics Occupational Employment and Wage Statistics (OEWS) survey, May 2026 release. A 5.00% compound annual growth rate (CAGR), derived from 6-year national BLS wage trends, was applied to estimate current 2026 hourly rates for radiologists in Richland. Part-time and full-time income estimates assume consistent weekly hours and do not account for overtime, benefits, or seasonal variation.
Data Sources & Methodology
Salary data for Richland is estimated from official BLS state-level occupational wage data (2025), adjusted for regional cost-of-living differences using BEA RPP (Regional Price Parities).
2026 figures are projected from 2025 BLS data using a compound annual growth rate (CAGR) of 5.00%, derived from historical BLS wage trends for radiologists (SOC 29-1224).
Compiled and verified by Dr. Maria Chen, MD, a licensed radiologist with 10+ years of clinical experience. · View source data at BLS.gov